

Understanding SPY volatilities, with a breakdown of IV Rank, Volatility Smiles, Risk Reversals, and more
As part of our free weekly educational series

(Check them out if you want to grow your social media or company’s investor reach)
Hey all,
This is the Unusual Whales Team, and we are going to spend every Wednesday walking you through some trades of the week for free to help your trading!
These educational tutorials will be options or equities focused to help you understand why or how interesting and useful trades were made, and how to utilize and read the various tools on Unusual Whales. If you enjoy these free tutorials, feel free to subscribe so we can keep writing these or share the Substack link.
In today’s issue, we’re going to go over near-term SPY implied volatilities. Utilizing the Unusual Whales Volatility page and metrics, Unusual Whales user and affiliate Dara Akhavein dives into each implied volatility chart for the SPDR S&P 500 ETF Trust ($SPY) and explains the metrics therein.
A Look At Near-Term SPY Implied Volatilities
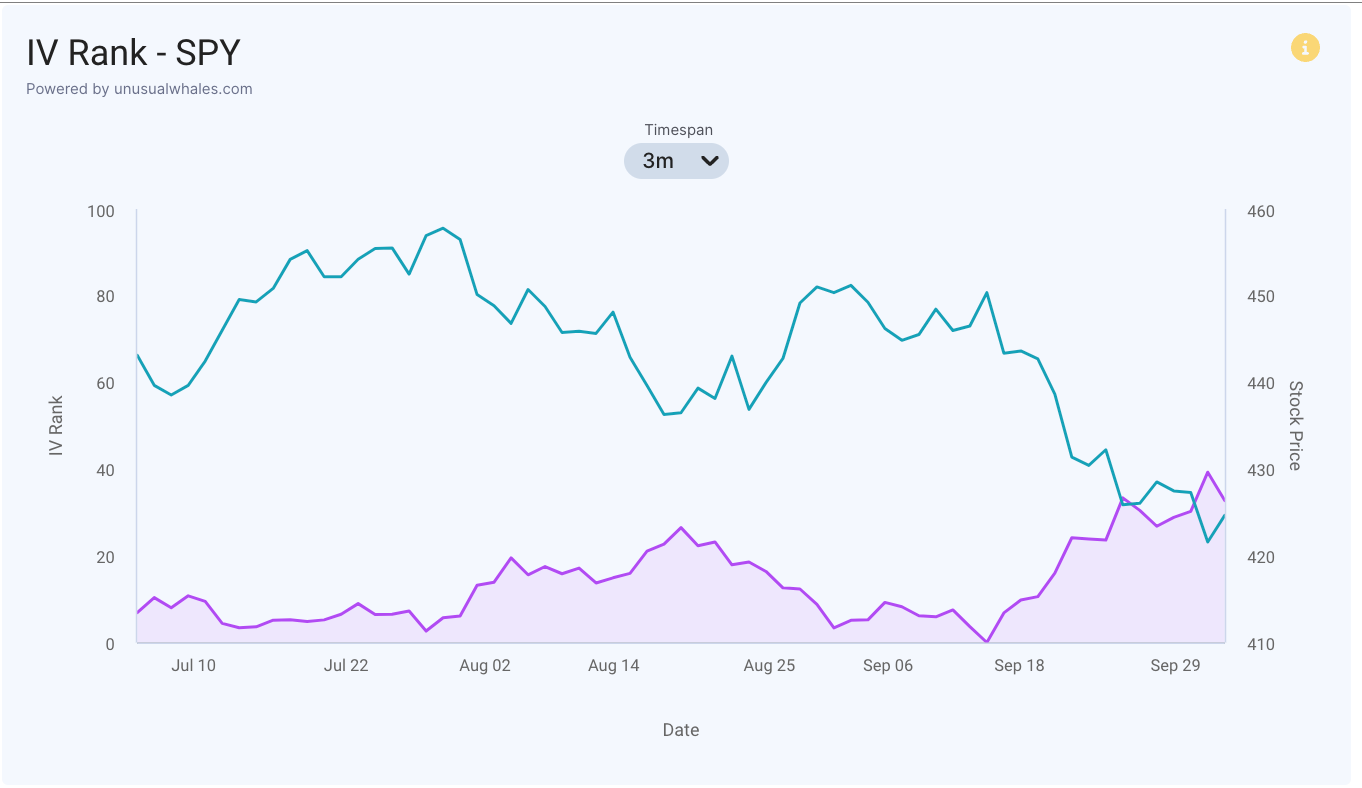
Examining the Implied Volatility Rank (IV Rank), which measures the implied volatility (IV) compared to its highest and lowest values over the past year, reveals a notable trend since mid-September. Relative implied volatility has been steadily increasing during this period, coinciding with a decline in the underlying SPY index. One can reasonably conclude that the recent SPY drawdown aligns with heightened demand for option pricing and insurance.

To gain further insights into the structure of future implied volatilities, it's essential to consider the term structure of SPY options. The term structure illustrates the relationship between implied volatilities and the time remaining until options expire. This provides traders with an understanding of how option writers anticipate volatility to manifest over different time frames.
In particular, the terms "contango" and "backwardation" help describe how the options market prices volatility concerning a reference point in time. Contango signifies higher expected future volatility, resulting in more expensive options, whereas backwardation represents the opposite – lower expected future volatility and less costly options.
Analyzing the current term structure, we notice a substantial drop in IV from October 5th to October 8th. However, it is anticipated that volatility will surge back up to October 12th. The factors influencing the term structure are numerous and can include market sentiment, economic conditions, data releases, earnings reports, dividend payments, interest rates, geopolitical events, federal reserve policy changes, supply and demand dynamics, volatility skew, and seasonal considerations.
Moving beyond the overall term structure, delving into the implied volatility smile for a specific expiration date provides further insight. This smile graphically illustrates how implied volatilities differ across various strike prices for that specific expiration date. It's worth noting that the term structure solely considers at-the-money (ATM) implied volatilities. To assess the implied volatility skew, which reflects the relative pricing differences between contracts, we need to examine the smile.

Recall the significant disparity in IVs in the term structure from October 5th to October 8th (we will also consider October 9th). Looking at the October 5th expiry, we observe that the implied volatility for at-the-money (ATM) calls is higher than for ATM puts. This implies that the options market assigns a greater likelihood of upward movement until approximately strike 430. Additionally, examining the ends of the smile reveals a preference for out-of-the-money (OTM) puts and in-the-money (ITM) calls over OTM calls and ITM puts. This smirk suggests an increasing value in downside protection relative to the potential upside (indicating a market bias). To conduct a more in-depth smile analysis, it's advisable to investigate variations in slope and region-specific anomalies.
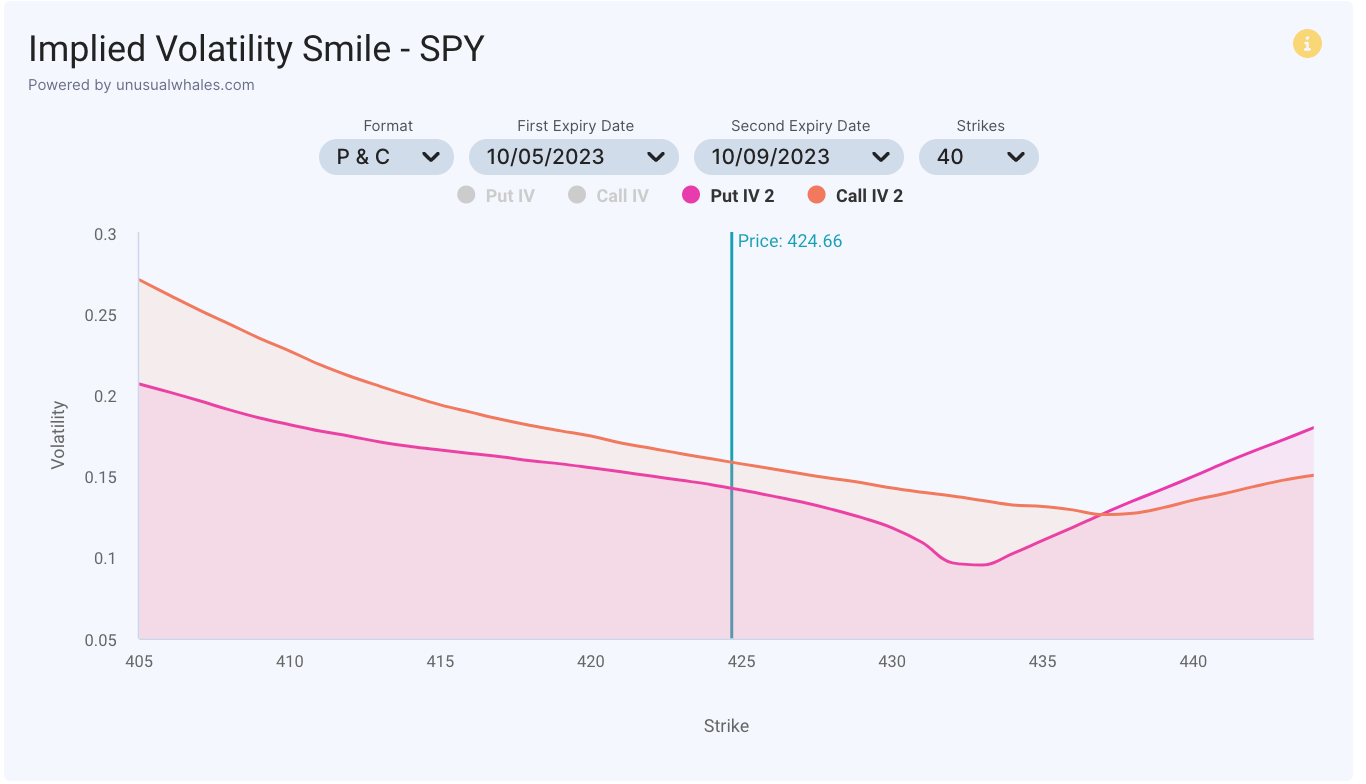
Turning our attention to the October 9th expiration, we observe a significant overall drop in implied volatility (compare the Y-axes of both smiles). Regarding the skew (differences in relative price) between strikes, calls remain more expensive at the money, hinting at a bullish implied bias. Although left tail IV remains higher, indicating an expected price rise from the current strike, when comparing tails, downside protection remains more expensive than the upside potential.

The risk reversal skew provides an alternative method for quantifying the cost of upside versus downside protection. It plots moneyness, considering the relationship between how out-of-the-money (OTM) or at-the-money (ATM) a contract is and its associated delta, against the pricing difference between puts and calls. Notably, near ATM deltas (around 0.5), calls are considerably more expensive than puts. Beyond approximately 0.25 delta (going further out of the money), puts become more expensive than calls. For very OTM contracts (tail risk insurance), puts are substantially more expensive than calls. This metric offers valuable insights into the options market's demand for and valuation of extreme market movements and identifies the direction that is more costly to hedge. Typically, more expensive insurance implies a higher likelihood of a payout. For a more nuanced analysis, consider examining the slope of the risk reversal skew, with steeper values indicating a greater deviation from implied 50/50 odds and a directional bias.
In summary, implied volatility rank (IV Rank) has been steadily increasing since mid-September, coinciding with a decline in the SPY index. This suggests growing demand for option pricing and insurance amid market uncertainty.
Examining the term structure of SPY options helps us understand how volatility is expected to evolve over time. The terms "contango" and "backwardation" shed light on pricing dynamics relative to a reference point, indicating expectations for future volatility levels.
The implied volatility smile, particularly for specific expiration dates, offers valuable granularity. It reflects varying implied volatilities across strike prices, revealing market sentiment and preferences.
Notably, differences in implied volatilities between ATM calls and puts, as well as between OTM and ITM options, provide insights into risk perceptions and biases.
The risk reversal skew further quantifies the cost of hedging upside and downside risk, emphasizing the market's pricing of extreme moves and directional biases.
Thank you as always for reading! I hope you find these types of articles helpful in your journey to learning how to read and interpret the different tools offered by Unusual Whales!
Have a great week and feel free to subscribe or share if you’ve enjoyed this!
NOTE: This post is not financial advice. The stock market is risky, and any trade or investment is expected to have some, or total, loss. Please do research before any trade. Do not use this information for investment decisions. Check terms on site for full terms. Agree to terms before considering this information.
NOTE: Unusual Whales is not responsible for any promotion. It does not verify the authenticity of the promotion or partnership, nor the merits of the individual promotion. Unusual Whales does not necessarily endorse any one promotion. Please do your own diligence and research before following any one promoted post. Do not consider a promotion of a post an advocation for the sponsor of the post. Do not invest because of any promotion. Do not follow any promotion unless you yourself think it worthwhile. Unusual Whales is not affiliated with any sponsor. Unusual Whales is being paid to promote the promotion. The post itself is an ad, and not a reflection of Unusual Whales itself. Please check full terms for details.