Understanding options flow during chaos (or high IV times)
As part of our free weekly educational series

🍒Open an account with our partner tastytrade for a UW bonus 🍒
Hey all,
Nicholas from the Unusual Whales team, here! We’re going to spend one issue every week walking you through some trades of the week for free to help your trading!
In this issue, we’re going to cover a few examples of “clean(ish) flow” versus “not so clean” flow. It’s important to know that the vast majority of options flow hitting the tape is inactionable noise, so this article will focus on differentiating between options flow that has too many “what ifs”, and options flow that gives a better idea of what you’re looking at.
To start us off, let’s look at an options flow example that doesn’t quite give us a great idea of what’s going on.
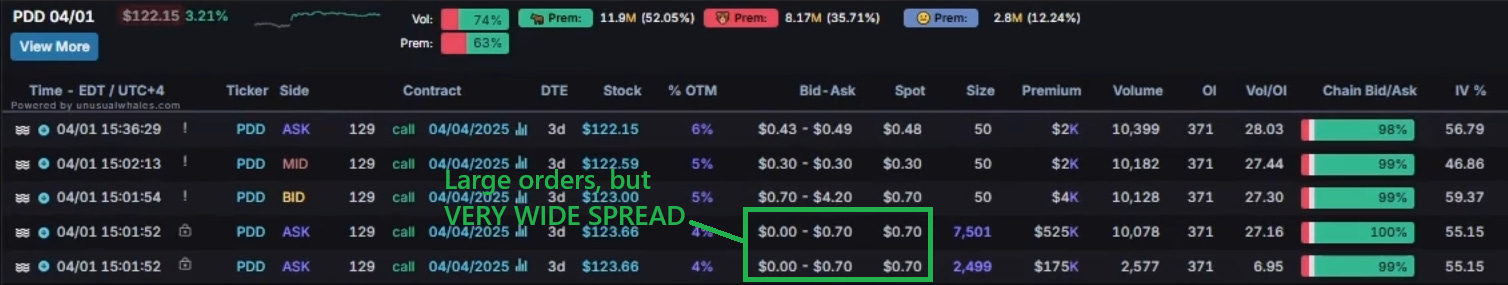
Here we have the PDD Holdings, $PDD, $129 call contract that expired back on April 4th. This bit of flow caught some attention due to the size (exactly 10,000 contracts split into two orders), the premium of $700,000, and the 100% ASK-SIDE fills. Indeed, these contracts did fill right at the ask of $0.70 per contract. However, look at the bid/ask spread. The ASK (best price someone is willing to sell a contract) sits at $0.70; right where the contracts filled. The BID (best price someone is willing to pay for a contract) sits at $0.00. Such a wide bid-ask spread like this can show some illiquidity for the contract.
Although the argument could be made that a perfect ASK fill in such a wide bid/ask spread indicates readiness to get into the trade, it also adds an air of uncertainty. Why didn’t they offer a lower price if the bid was at $0? I don’t know. Why not try to trickle orders in? Are they short shares? Are these even longs? They’re ask side! Remember, ask fills do not guarantee buy to open. My answers to the questions above? Still I don’t know. If I don’t know, or have a solid idea of what’s going on with any given options flow, I move on and ignore.
Let’s look at another example, here; perhaps a better one.
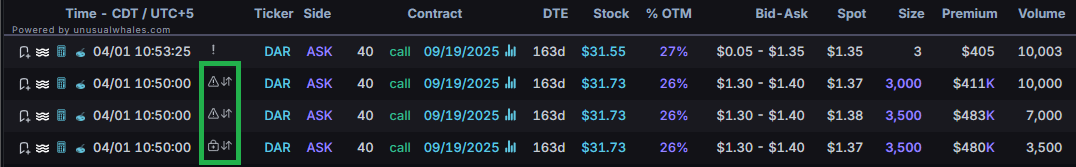
Here we have the $DAR $40 call contract expiring on September 19, 2025. This one APPEARS to be interesting; we’ve got 10,000 contracts transacted at $1.37, certainly ask-side given the spread of $1.30 and $1.40. However, note the multi-leg transaction symbol in the column left of the ticker. Here is where things get a bit wonky. Let’s click that multi-leg symbol and see what these contracts were paired with.
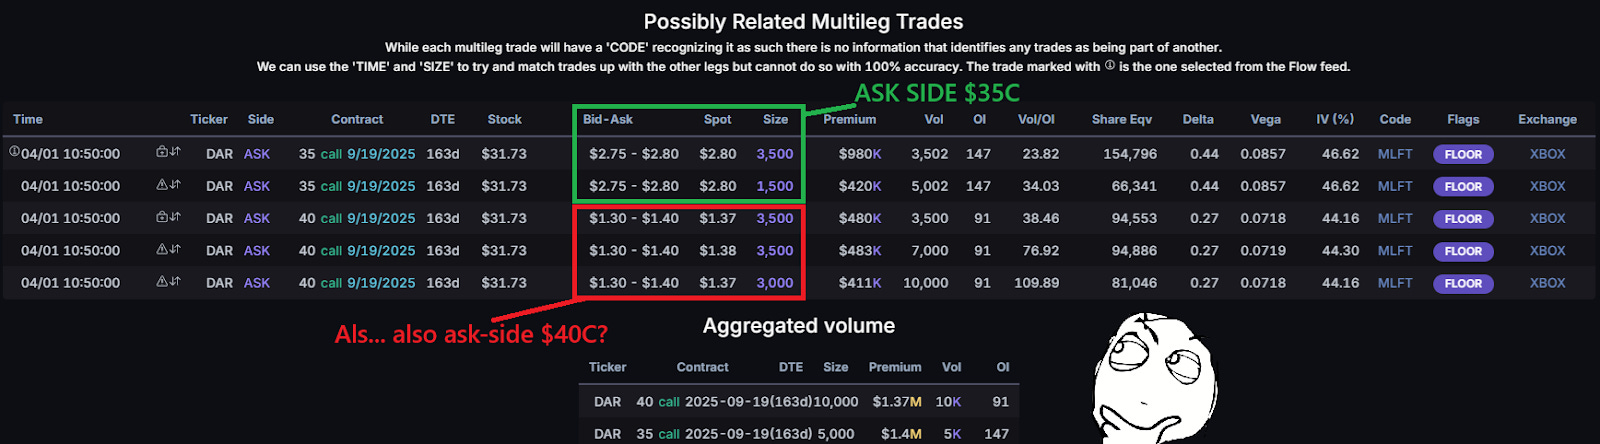
There we have it; at the same time stamp with similar premium (roughly $1.4 million), the $35 call contract of the same expiration date transacted in roughly ½ the size of our $40C.
Definitely a multi-leg, but… uh oh… BOTH legs of the trade appear to be bought to open. Hmm…. Yeah, both the $35C and the $40C transacted ASK side, with low open interest so we know they’re both opening positions and not a roll or something. Now, generally speaking, it’s fairly unlikely that a spread like this (which appears to be some sort of Ratio Spread) has two legs that are both bought to open.
This leaves us with some serious lack of clarity. Was one of these legs short? Which one? What’s the spread they’re targeting? We can speculate on all of this, but this $DAR spread is just too unclear; it’s a textbook example of “I don’t know”. Not knowing isn’t something that should bring shame–it should just tell you “This isn’t something I’m gonna trade”.
Before I get to the next bit, Unusual Whales has partnered with tastytrade to provide the best experience for you as a trader. Get the best platform for trading options and US equities, and get 25% off your first 4 months of Unusual Whales when you use our link.
Just sign up for a new tastytrade account, link your account to Unusual Whales, and you’ll get 25% off your first four months, AND the ability to trade DIRECTLY from the Unusual Whales platform!
Alright, now let’s look at an example of options flow that is a bit less confusing.
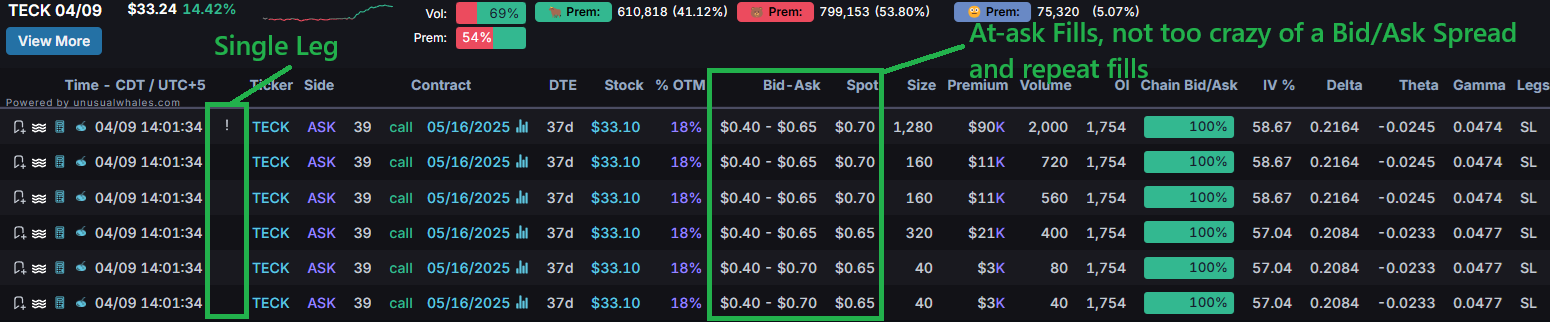
Here we have the $TECK $39 call contract expiring on May 16th, 2025. First off, we see that it’s a single leg trade with no stocks or other option contracts attached to it. Now this is by no means a FIRM criteria for flow–everyone has their own style and their own types of trades they prefer.
Along with the single-leg status, we’ve also got repeat action on the contract, with ascending size, all filling right on the ask price. Mind you, the spread here is a little wide, but it isn’t crazy like the above example with a $0.00 bid price. This $TECK transaction was also spotted on 4/9 where crazy amounts of volatility hit the markets, so with that in mind as well, this spread isn’t super crazy. The open interest is a bit high, at 1,754. The total size of these transactions is higher than that, but that doesn’t guarantee new positioning, so I always like to check historical flow on these.
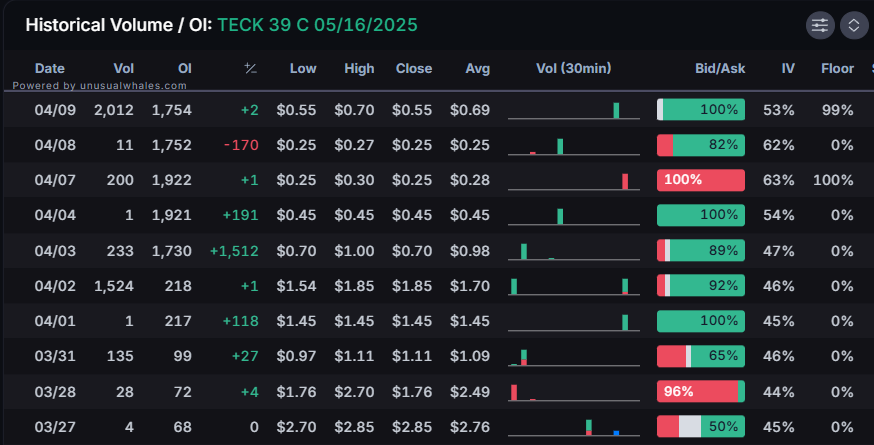
Here we can see that the open interest came from transactions on April 2nd, that also filled almost entirely at the ASK price of the contract. The sizing isn’t terribly far off, but given the nature of the fills, this seems more likely to be a new position than it does a closing one.
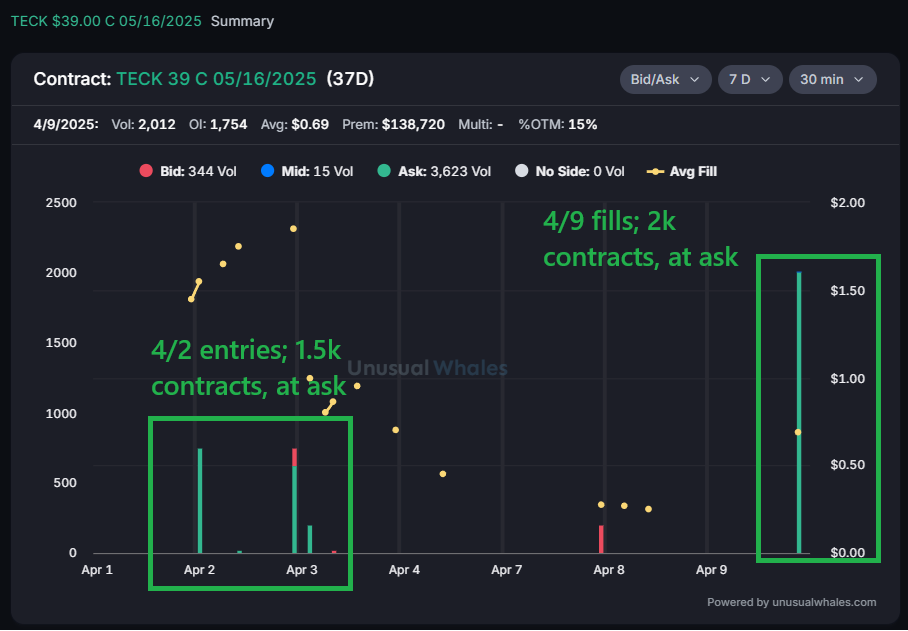
Here we can see the transaction volume candles; each of the entries from April 2nd are roughly equal in size, and combined they do sort of match the 2,000 contracts transacted on 4/9; however the ask side fills on both sets of transactions, the time gap between the two, and the fact that the price is currently 1/3rd that of the fills on 4/02, this seems much more likely to be an opening trade.
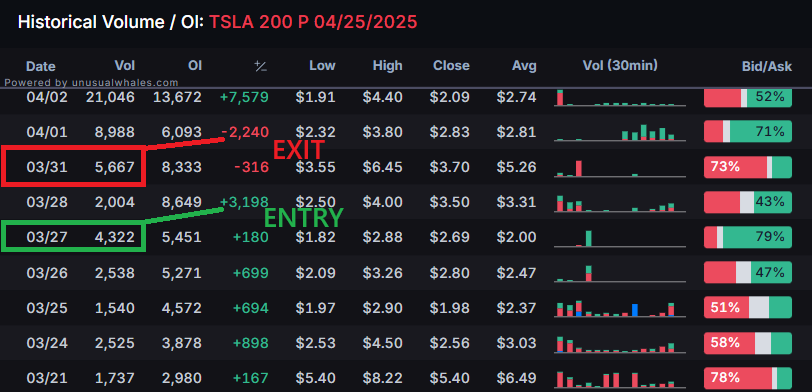
Now one last little diddy here; an example of when past fills likely ARE related to recent transactions. Here we have the $TSLA $200 put contract expiring on April 25th. On March 30th, some traders noted sizeable BID SIDE activity on the contract, with 4,000+ contracts transacting. However, a peek at the open interest tells us that this COULD be an exit.
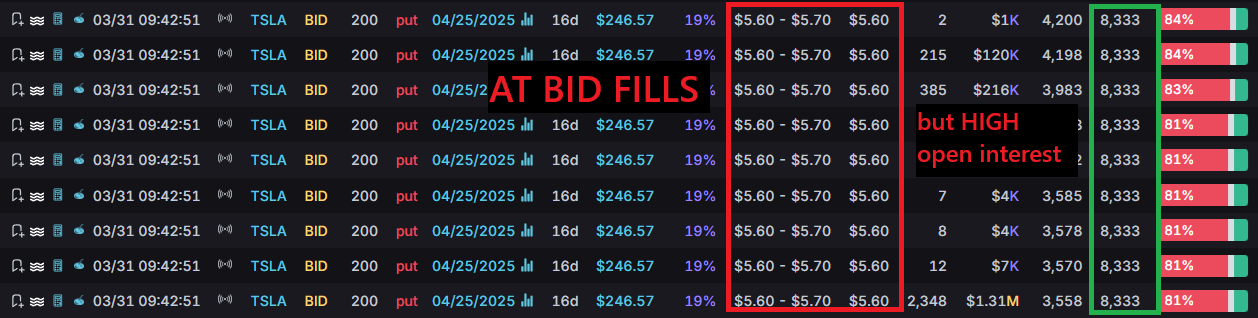
Lo and behold, back on March 31st, the SAME amount of contracts transacted and carried over into open interest, but from ASK side fills. We can see as well in retrospect that the volume on 3/31 was indeed closing volume with its bid-side transactions; the open interest dropped substantially the next day.
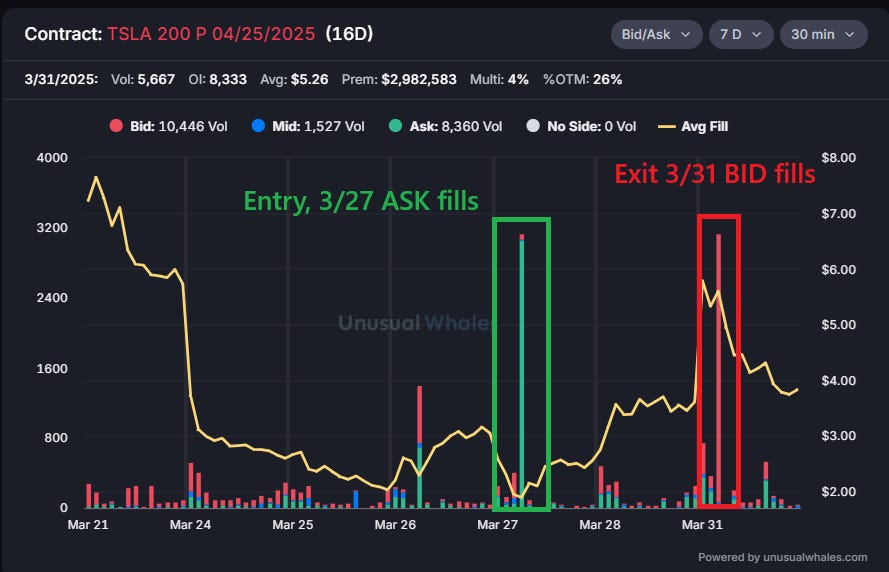
And just to make that picture a BIT clearer, here we can the volume candles for the contract. The first candle is the 3/27 entry with ask-side fills; the second candle is the 3/31 exit with bid-side fills. See how equal those candles are? Almost certainly an entry and an exit.
Naturally, none of this is the end-all-be-all; there is always context to flow, and most of the time (yes, most of the time) we can’t be certain what exactly is going on (unless we ourselves are the trader(s) behind the transactions). But little things like these examples can help us narrow things down and use what context we do have to generate an idea of what’s going on.
Thank you as always for reading! REMEMBER!! You can get 25% off your first four months of Unusual Whales when you open a new tastytrade account and link it to your UW account!
find articles like this and MANY others about Options and the Unusual Whales Platform on the new Information Hub!!
NOTE: This post is not financial advice. The stock market is risky, and any trade or investment is expected to have some, or total, loss. Please do research before any trade. Do not use this information for investment decisions. Check terms on site for full terms. Agree to terms before considering this information.