

Options Profit Calculator Walkthrough, and Valentine's Day Sale
As part of our free weekly educational series

Hey all,
This is the Unusual Whales Team, and we are going to spend every Wednesday/Thursday walking you through some trades of the week for free to help your trading!
Before we get into it, Unusual Whales is having a Valentine’s Day Sale until February 19th!

Get 15-20% off all tiers, including the new Portfolio feature.
These educational tutorials will be options or equities focused to help you understand why or how interesting and useful trades were made, and how to utilize and read the various tools on Unusual Whales.
In today’s issue, we cover how to spot multi-leg trades in the Flow Feed, and how to load trades into the Options Profit Calculator directly from the feed. We’ll also take a look at how to gauge profit and loss of the position using the calculator.
Now let’s jump right into recognizing multi-leg trades in the flow, and how to open the potential spread in the Options Profit Calculator.

If a trade is potentially part of a multi-leg options transaction, the up-down arrow symbol will appear. Clicking on that symbol will open a pop-out window that displays which contracts are potentially part of a multi-leg trade with the selected contract. Now, let’s click on that symbol and take a look at this PayPal, $PYPL, multi-leg transaction.

Above we see two separate options transactions that are potentially related. 2,500 size of the $PYPL $70C 9/20/2024 transacted at $3.05 within a bid-ask spread of $3.00 - $ 3.20, much closer to the bid than the ask. The $65C 9/20/2024 transacted at $4.45 within a bid-ask spread of $4.30 - $4.50; much closer to the ask than the bid, in equal size of 2,500. As we’ve mentioned before, transactions significantly closer to or on the bid have a higher likelihood of being sold, and transactions closer to or on the ask have a higher likelihood of being bought. In this case, the $70C was more likely sold than bought, and the $65C was more likely bought than sold.
Often when we see a bid-side call and an ask-side call like this, we can speculate the contract is being rolled; or closed in favor of a new contract. However, we can be confident that this particular multi-leg transaction is not a roll. This is because the SIZE of both legs of the trade is larger than the total prior daily volume and open interest combined. Therefore, we can deduce that both legs of this multi-leg transaction are newly opened trades, not a roll.
In the middle of the pop-out is the Strategy Identifier. This feature gives you the potential types of spreads that this multi-leg trade may be. For this trade, we see Call Debit Spread and Call Credit Spread as potential strategies. A credit spread would insinuate this trader received a net credit for opening the position. However, as we can see, the long leg of this trade (the $65C) involved significantly more premium to buy than the trader received from writing the short leg (the $70C). That means this is more likely a Call Debit Spread, or a Bull Call Spread.

The speculation made with a call debit spread is that the stock price will rise, similar to buying a naked call. However, this spread allows you to open a bullish position for cheaper. With naked calls, you’re paying the full premium for your position; with a bull call spread, you only pay the difference between the amount received for the short leg and the amount paid for the long leg.
The max loss on a bull call spread is the premium paid to open the trade -- exactly like a long call. The "protection" you get from the short leg softens the blow if the price of the underlying moves against you, but in exchange for that protection you sacrifice the (potentially) unlimited profit of the long call. The max profit on a bull call spread is the width of the spread minus the debit you paid to enter. So if you buy a bull call spread on hypothetical stock XYZ for $0.50, your max profit will be $9.50 ($10 gap between the strikes minus the cost of entry of $0.50).
If the price of the stock drops, the value of both call contracts will drop. Since one leg of the spread (in this case, the $70C) was sold short, the trader “profits” as the value of that contract drops, while they lose money on the long call (the $65C). Therefore, the losses are capped at the difference in value between the legs at expiration. The profit is also capped, however; the maximum profit attainable in a bull call spread is limited to the value between the cost of each leg.
Before we get to visualization of this spread in the Options Profit Calculator, a quick reminder that Unusual Whales tracks numerous public figure portfolios, including all U.S. politician trades, and publicly announced trades made by figures such as Dave Portnoy! Here we see Representative David Rouzer’s portfolio sitting at a current return of 306.96%!

Get the Portfolio subscription for a reduced price now. And follow any politician's portfolio!
Now, let’s view the $PYPL Call Debit Spread in the Options Profit Calculator.
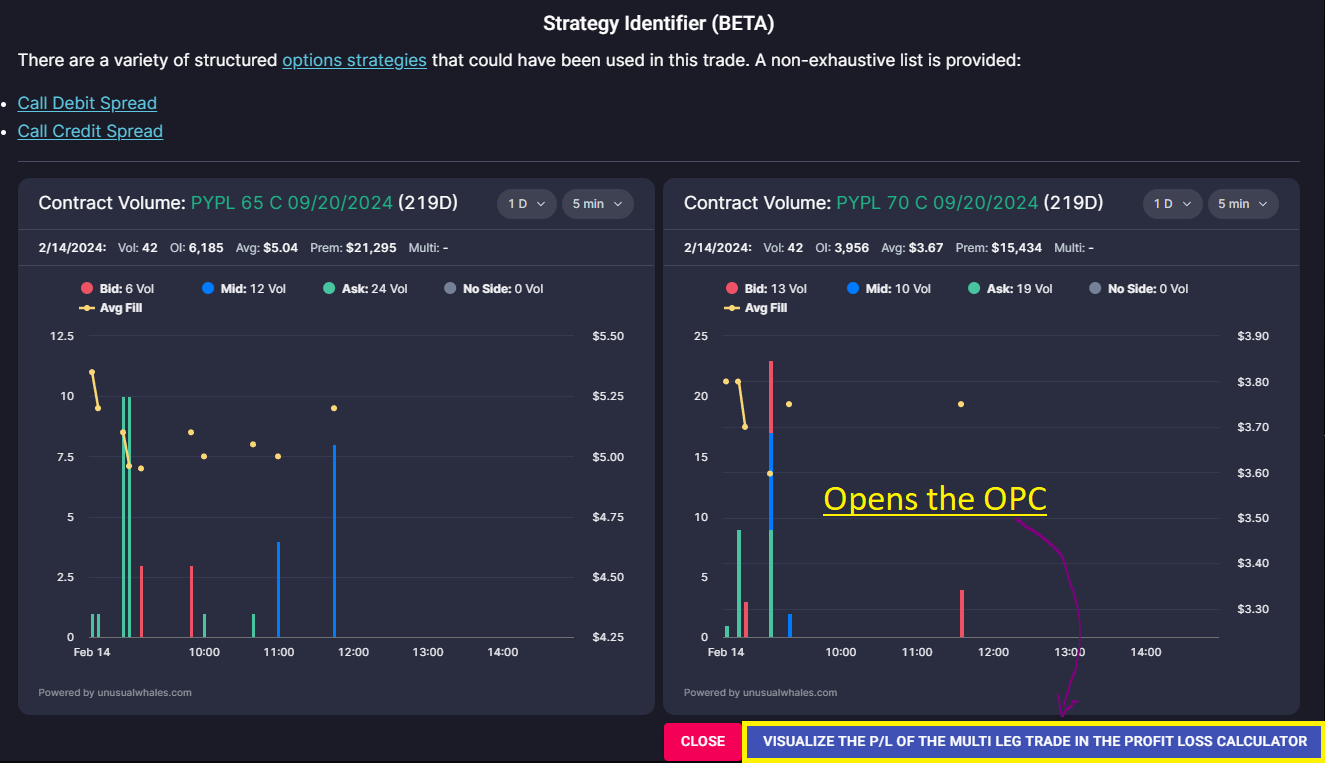
To open the specific trade you’re viewing in the OPC, all you have to do is click the “VISUALIZE THE P/L OF THE MULTI LEG TRADE IN THE PROFIT LOSS CALCULATOR” button in the bottom right hand corner of the trade pop-out.

The first view given in the OPC displays the cost of the spread (Net (Debit)), the Max Loss of the spread, and the Max Profit of the spread. Here, we see the Max Profit is limited, not hypothetically infinite as a naked call would be. At expiration, if the value of the stock is anywhere from $0 to $65, the spread will be at its max loss. If the value of the stock is at $70 or higher, the spread will be at its max gain. And if the price at expiration is somewhere between $65 and $70, the spread will be valued at the expiration price minus $65 (so if the stock closes at $66.15, the value of the spread will be $1.15).

Here we see the profit and loss displayed in a table. This shows us the expected value of the spread over time, and at different stock price points. We can take this even further, including a visualization of the relative trade breakeven price with the Profit & Loss Chart.
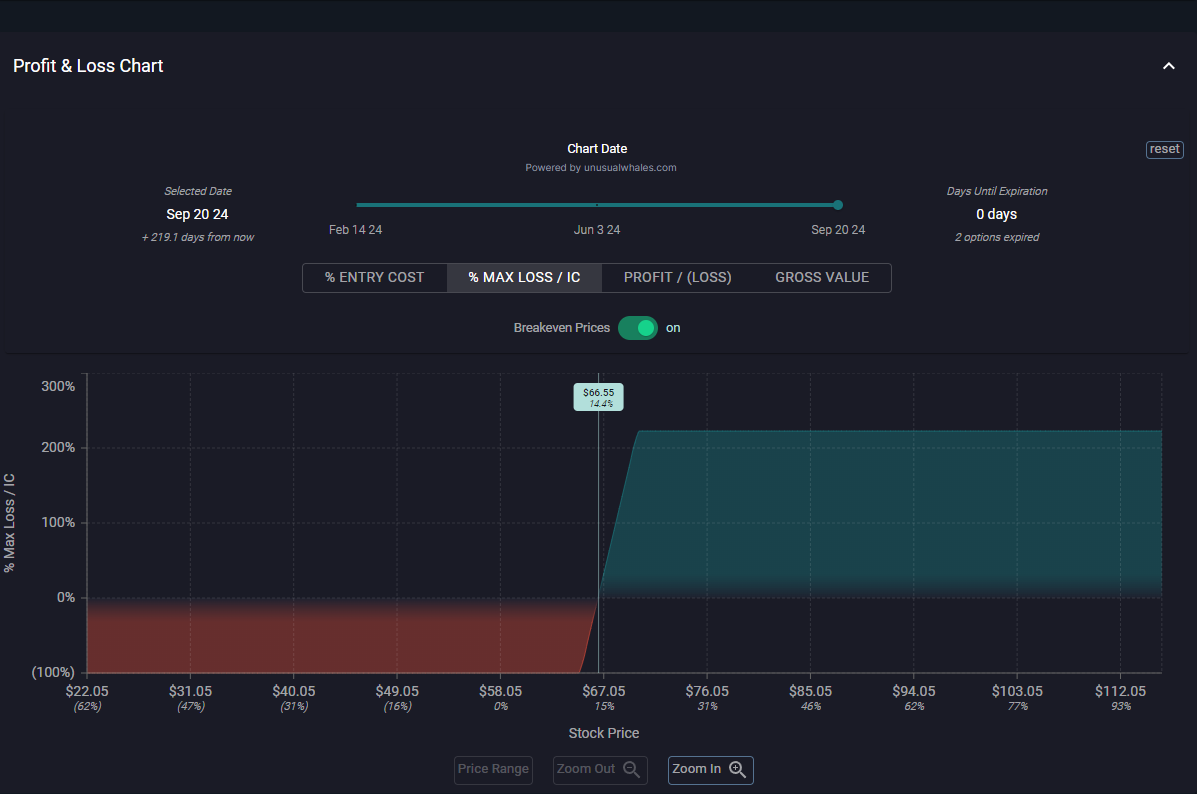
Remember, the profit is the difference between the value of the spread and the debit you paid for it! If you paid $1.50 to enter the 65/70 bull call spread and at its expiration the underlying is at $66.15, you will lose $0.35 because your debit was $1.50. Here's a handy way to keep track of your "breakeven" price on a bull call spread: add the debit you paid, in this example $1.50, to the long strike, in this example $65.00, and you get $66.50. If the stock expires above $66.50, you will make at least $0.01, but any price below that will be a loser. In the Profit & Loss Chart above, we see that the relative lowest stock price for profitability falls around $66.55.
Remember, Unusual Whales is having a Valentine’s Day Sale until February 19th! Get 15-20% off your subscription, including the Portfolios feature!
Thank you as always for reading! I hope you find these types of articles helpful in your journey to learning how to read and interpret the flow and all the tools therein!
NOTE: This post is not financial advice. The stock market is risky, and any trade or investment is expected to have some, or total, loss. Please do research before any trade. Do not use this information for investment decisions. Check terms on site for full terms. Agree to terms before considering this information.
NOTE: Unusual Whales is not responsible for any promotion. It does not verify the authenticity of the promotion or partnership, nor the merits of the individual promotion. Unusual Whales does not necessarily endorse any one promotion. Please do your own diligence and research before following any one promoted post. Do not consider a promotion of a post an advocation for the sponsor of the post. Do not invest because of any promotion. Do not follow any promotion unless you yourself think it worthwhile. Unusual Whales is not affiliated with any sponsor. Unusual Whales is being paid to promote the promotion. The post itself is an ad, and not a reflection of Unusual Whales itself. Please check full terms for details.