How to Use the Net Premium Tool on Unusual Whales
As part of our free weekly educational series

Hey all,
This is the Unusual Whales Team, and we are going to spend every Wednesday/Thursday walking you through some trades of the week for free to help your trading!
These educational tutorials will be options or equities focused to help you understand why or how interesting and useful trades were made, and how to utilize and read the various tools on Unusual Whales.
In today’s issue, we’re going to cover how to read Net Premium for a ticker, and will also go over an example where Net Premium may not be all it appears to be.
Understanding the Usefulness and Shortcomings of Net Premium
To start us off here, what exactly is Net Premium? Net Premium is a concept derived from the Market Tide and Net Flow features. Net Call Premium is the premium value derived from the daily call activity using the following example:
- $15,000 in calls transacted at the ask has the effect of increasing the daily net call premium by $15,000.
- $10,000 in calls transacted at the bid has the effect of decreasing the daily net call premium by $10,000.
The resulting net premium from both of these trades would be $5000 (+ $15,000 - $10,000).
Transactions taking place at the mid are not accounted for in this calculation.
Net Put Premium is the premium value derived from the daily put activity using the same example as above.
Now, let’s break down this Net Premium Call/Put chart on $AMD.
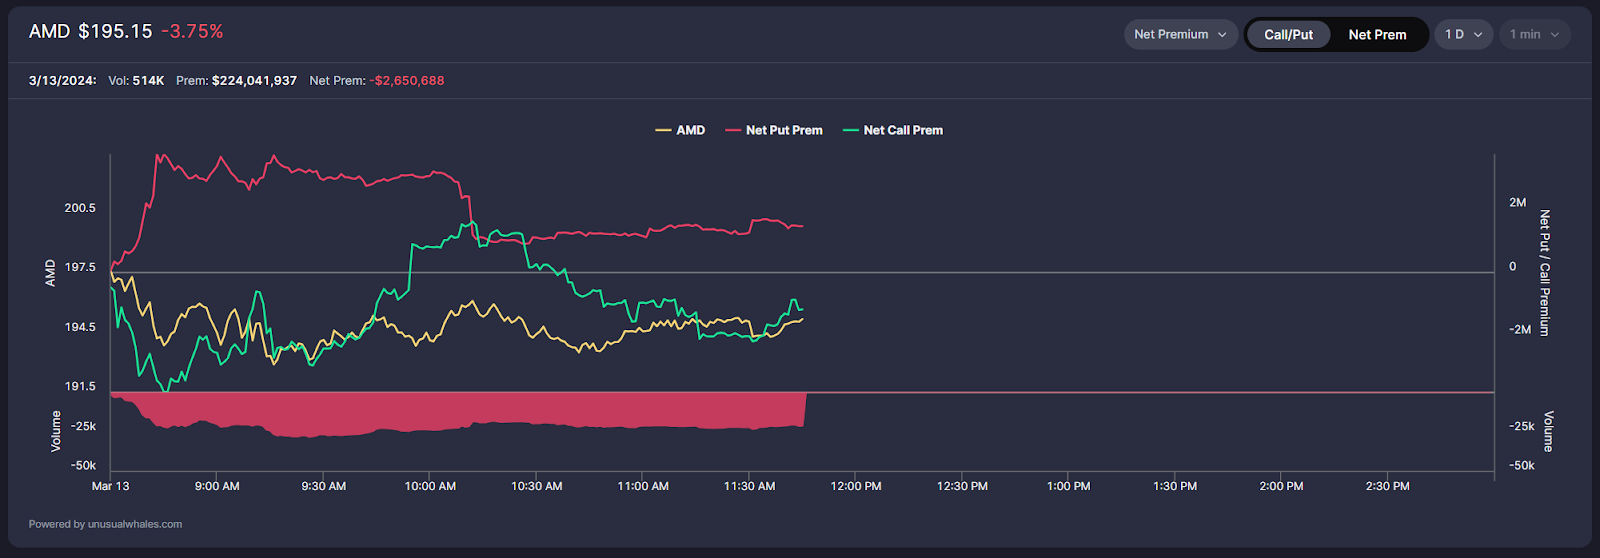
- The yellow line represents the stock price of the equity in question
- Ask-side call activity moves the green line up
- Bid-side call activity moves the green line down
- Ask-side put activity moves the red line up
- Bid-side put activity moves the red line down
- Activity taking place at the mid is not considered
This view allows you to track the net call premium (ask side transactions less the bid side transactions) and net put premium together, in reference to the stock price. Based on the chart above, the Net Premium on Puts (red line) is positive, whereas the Net Premium on Calls (the green line) is negative. This would, in simple terms, translate to a relatively bearish Net Premium.
You can also change the chart to see ALL Net Premium in one line.
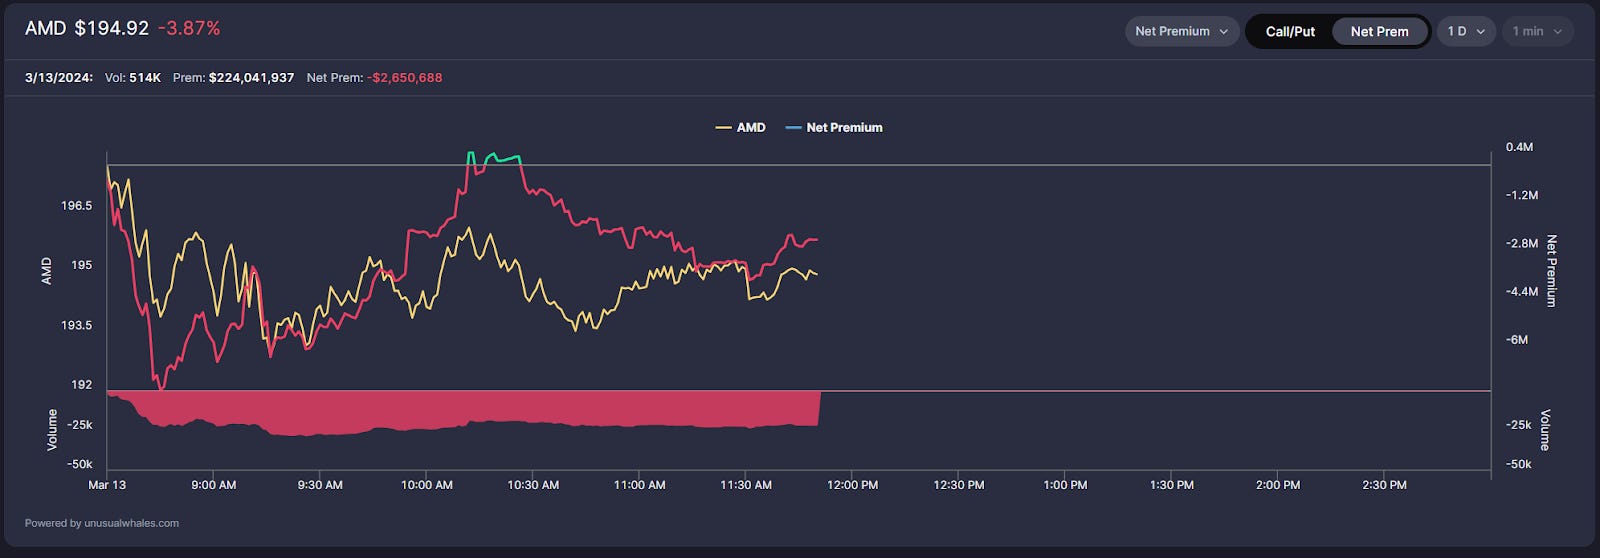
The way this Overall Net Premium chart works is the same as the Call/Put, only the Net Premium is combined. So in this case, Net Bullish Premium (Ask side Calls, Bid side Puts) makes the line rise; Net Bearish Premium (Ask side Puts, Bid side Calls) cause the line to drop. If the line is above $0 Net Premium, it turns green, showing more bullish premiums than bearish; if the line is below $0 Net Premium, it’s an indication that more bearish premiums are transacting.
So now you may be thinking, “Green Line Bullish, BUY CALLS!” Well, not so fast.
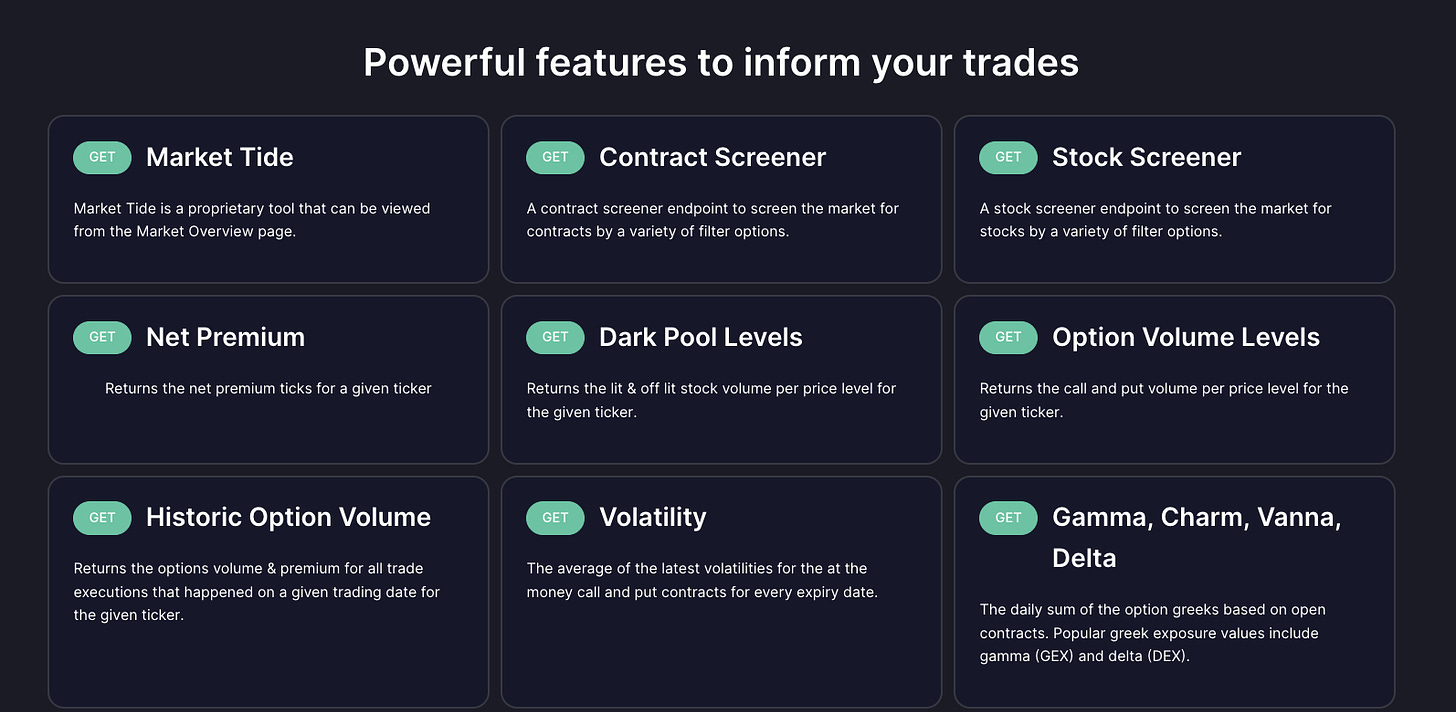
But before we continue, some UW news first! We launched our API last week which gives you access to new market data, and unique UW options data. For enterprise users, we have a significant offering available: https://unusualwhales.com/public-api
We also added new profiles to our Portfolios feature including the Portnoy Portfolio, Inverse Portnoy, Pro Cramer, Inverse Cramer, and two general Congress and Inverse Congress ETFs. Come join it today by clicking here! Alright, now back to the net premium tool:
We have to keep in mind that although Net Premium is a great way to get a quick view of options market sentiment, it is NOT a perfect one-size-fits-all tool as outlined in this short video.
One reason for this is that transactions at the ASK are not necessarily BUYS, nor are transactions at the BID necessarily SELLS. The likelihood of one or the other is simply higher based on the fill price.
In addition, and this one rings especially true, transactions at the ASK are not necessarily bought to open, and could just as well be a trader exiting a prior position. Let’s look at a quick example of what I mean, here.
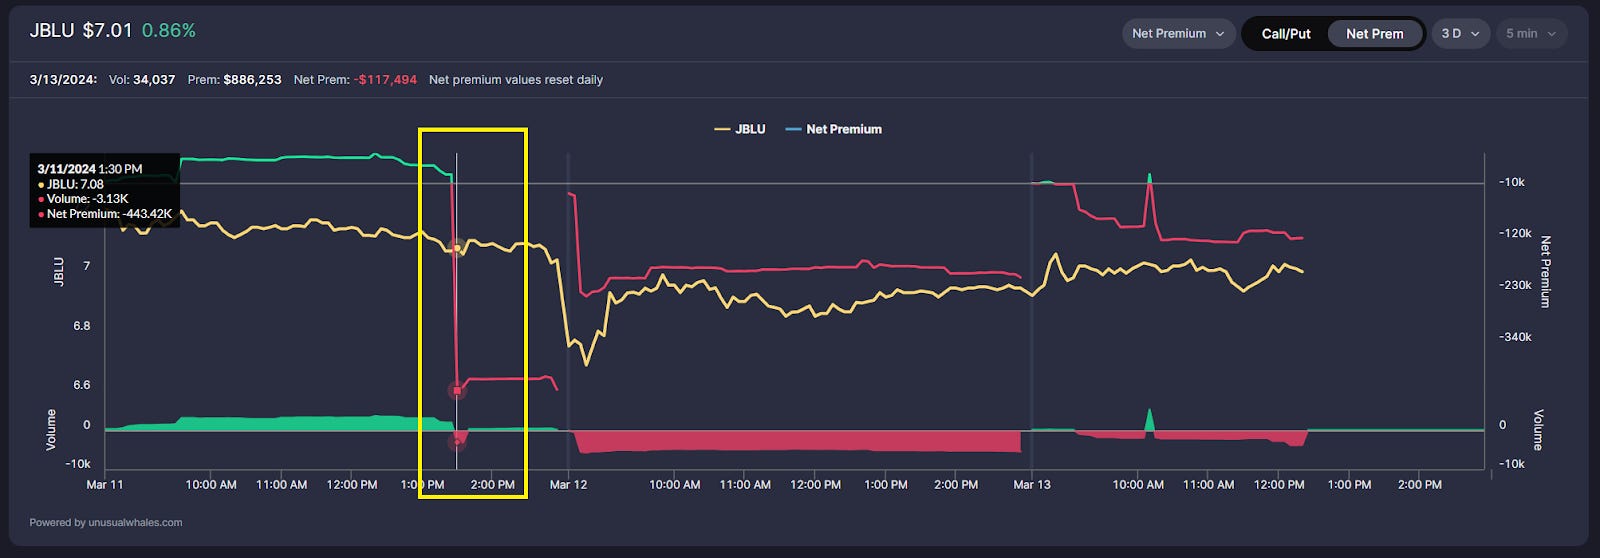
Here’s an example using JetBlue Airways, $JBLU. Notice the major drop in Net Premium on March 11th, 2024. Net Premium went from roughly +$18.7k to -$443k in an instant. Super bearish, right?
Not necessarily.
If we look at the options flow for that time period, one transaction really stands out.

5,000 volume of the $7C 6/21/2024 transacted at the BID for a total premium of $470k. Since these were CALL contracts transacted at the BID, that means the Net Premium of that transaction is negative. Given the Size of the trade relative to the Open Interest, we can’t confirm at a glance that this is a new position, and it seems more likely that this is a position closure.
“But even though volume was greater than OI, couldn’t that still be an opening trade, and therefore still bearish?”
It could, but a closer look shows us that this is not the case.
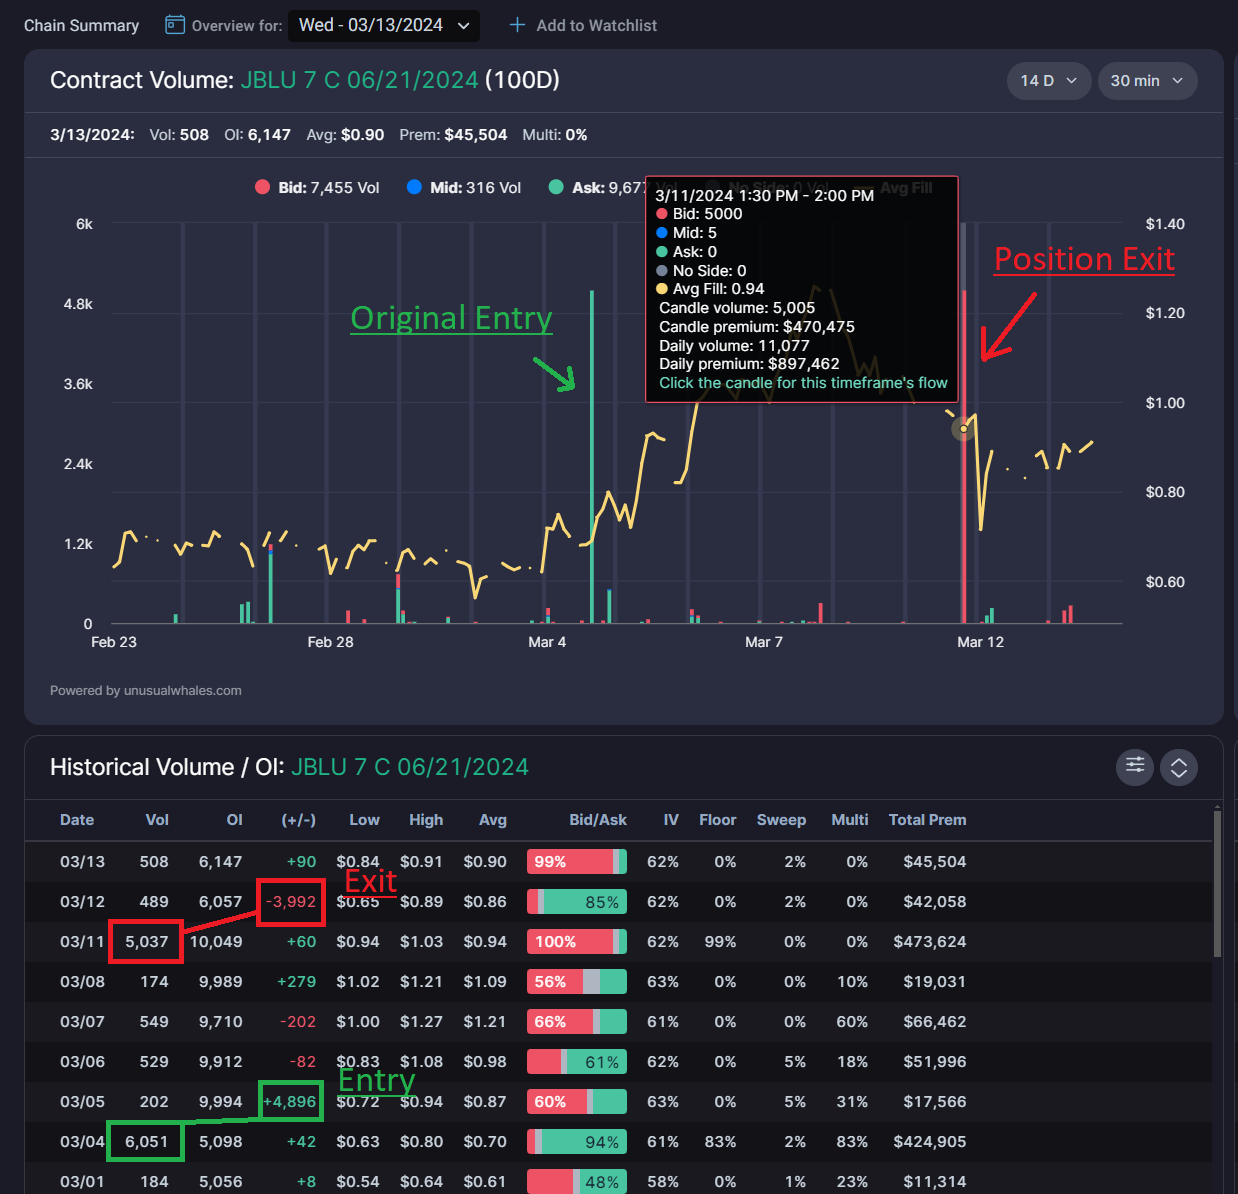
Looking back at the Historical Volume / OI, we can see that this original position was opened on March 4th, 2024, when roughly 5,000 contracts transacted at the ASK (the green boxes, and big green volume bar). The contracts carried over into the next day’s OI, so we know a new position was opened, and it stayed open.
Fast forward to March 11th, 2024; the day we noted the massive drop in Net Premium. There’s our 5,000 contract order transacted at the BID in red boxes, and the volume bar of BID side transactions is identical in size to our original entry. The following day, on 3/12, the OI dropped significantly, confirming to us that a position had been closed out.
Here’s another view of the Net Premium at the time this transaction took place, only showing the Call and Put net premium separately.
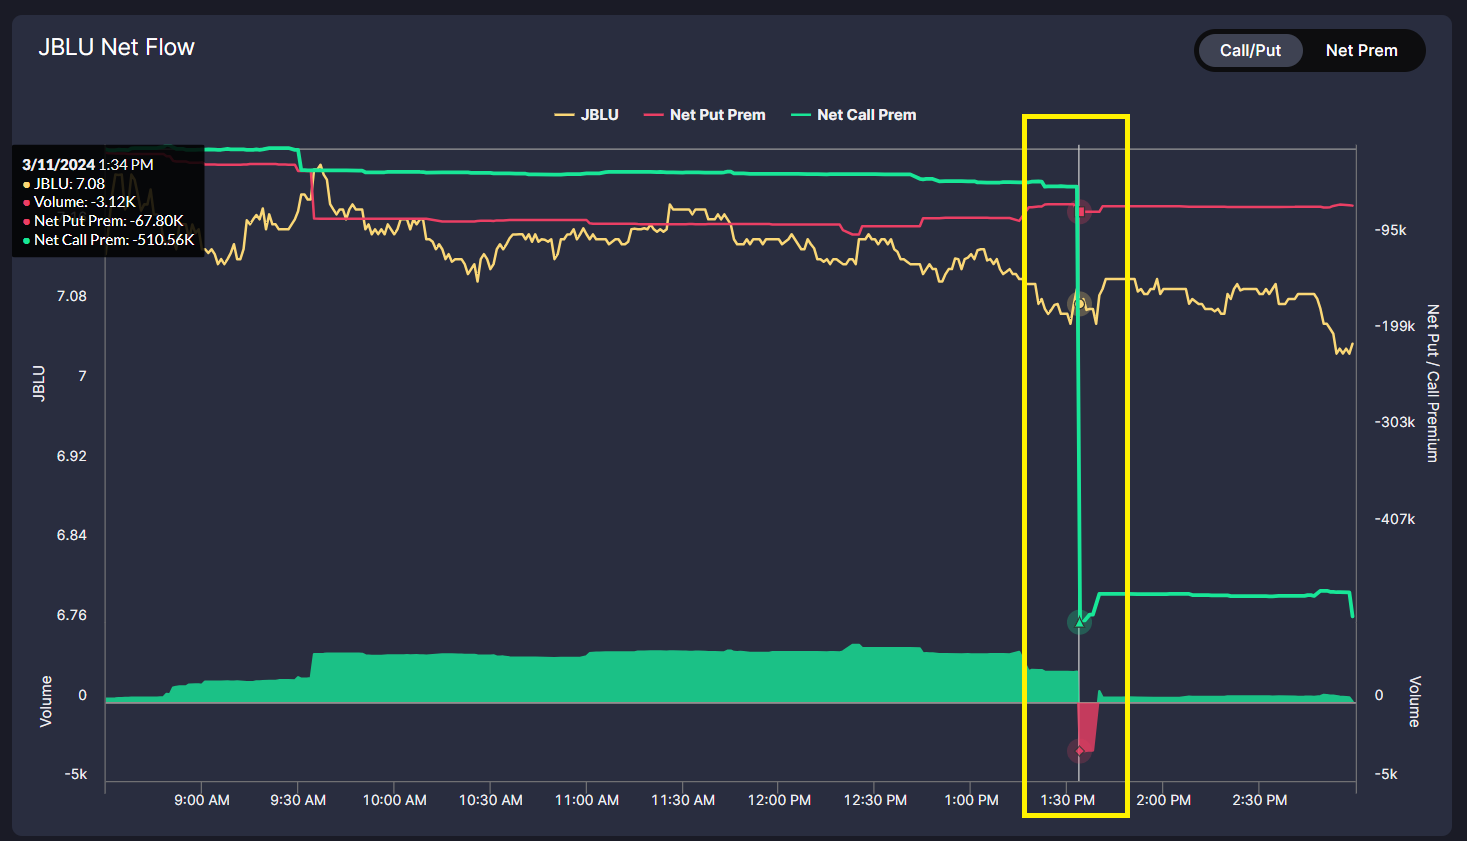
Note the dramatic drop in Call premium–that was entirely caused by this one transaction, by itself, with no change in the Put premium showing two-sides of bearish activity; no other context at all.
This $JBLU flow serves as a perfect example that, while it is an irreplaceable, priceless tool to have, it’s important to remember to look closer at context and make sure the Net Premium bias reflects the options flow as a whole!
Thank you as always for reading! I hope this article and the examples paint a good picture of Net Premium and how to confirm it with options flow for context.
NOTE: This post is not financial advice. The stock market is risky, and any trade or investment is expected to have some, or total, loss. Please do research before any trade. Do not use this information for investment decisions. Check terms on site for full terms. Agree to terms before considering this information.