

How to use Gamma, Spot Gamma OI, and note changes intraday on Unusual Whales
As part of our free weekly educational series.

🍒Get a $50-$5000 bonus when you open an tastytrade x UW account🍒
Hey all,
This is the Unusual Whales Team, and we are going to spend every Wednesday walking you through some trades of the week for free to help your trading!
In today’s issue, we break down some more information regarding Spot Gamma, namely, why Spot Gamma’s open interest value changes intraday.
Why does the Spot Gamma ($) Open Interest value change during the day?
QUICK ANSWER: OI is constant on this graph but the measurement "Spot Gamma ($) Open Interest" value will change throughout the day because gamma values by strike are constantly changing due to changes in the spot price of the underlying.

IN-DEPTH ANSWER: The "Spot Gamma ($) Open Interest" value changes during the day because gamma values change as spot price changes. (Remember, open interest is locked during the trading day and only updates the following morning.) Let's illustrate how this happens by building our own simplified chart by hand.
First, remember that gamma values are always positive and highest at the money. Here's a graph of gamma values from our friends at the Options Industry Council:

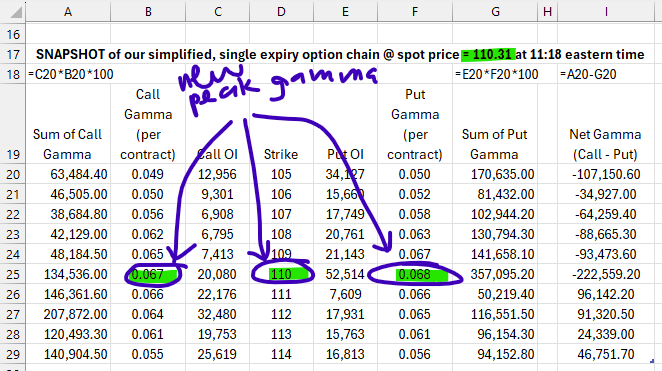
With that in mind, let's imagine an option chain that only has one expiry and ten strikes. Let's take a "snapshot" of this option chain at 11:15am eastern time when the spot price of the underlying stock is $109.31.

We know that our Call OI and Put OI will not change at all during the day, so those values (in columns C and E) are steady. The gamma value at each strike, on the other hand, WILL change as the spot price changes. This is a snapshot though, so time and price are frozen, which means we can use those values to sum the gamma for each strike at this moment.

Voila! We now have the total gamma, for Calls and Puts, by strike price. Keeping track of these separately is kind of a pain, and even though we know the gamma value is positive for both Calls and Puts, it would sure be convenient if we could somehow combine these two to make this a bit easier to read. Let's decide that even though Put gamma is technically positive, we are going to subtract it from Call gamma to get a "net" total for each strike.

Before we get to the rest of our breakdown, Unusual Whales has launched an ALL NEW Info Hub!

Unusual Whales is always working on numerous features and education. Now, that education is all in ONE spot
From Guides on the Platform to General Options Education, the Unusual Whales Information Hub has you covered. What else would you like to see?
NOW, back to the Spot Gamma breakdown!
Now that we have a net value for each strike we can visualize the results and see how similar it looks to what is presented on the Unusual Whales site.

(Of course, on the Unusual Whales site, we are doing this across many more strikes and expirations, but this example is meant to be very simple so it is easy to follow along.)
If the underlying stock price goes up, we know that the total gamma by strike is going to change because the gamma value will be highest at the money. Let's create another snapshot where the underlying stock price has increased by $1, shifting our gamma values accordingly.
Predictions and Chart
Before we create our chart, let's take a moment to predict what will happen:
The gamma "peak" value is now closer to higher strikes, so the total gamma sums above spot price should increase
Often, but not always, we see market participants trading more OTM Calls than ITM Puts, so if we see a greater number of OTM Calls than ITM Puts above spot price then it's more likely to see Call gamma dominate
This same effect can be observed below spot price where OTM Puts will frequently outnumber ITM Calls, meaning we will likely see Put gamma dominate below spot price
And that's mostly what happens:

However, if you look very closely at the 110 strike, you can see that even though price increased, the net gamma on this strike got MORE NEGATIVE! What's going on here?

I see -- the 110P has the most open interest and also has the highest gamma value. Of course it got more negative!
We expect the same thing to happen, but in reverse, if spot price shifts down, since the "peak" of the gamma curve will shift down too, making the total gamma below spot price even more negative. Let's test that hypothesis.

Our hypothesis has been confirmed, the total gamma for the strikes below spot price have indeed become more negative.
REMEMBER!! You can find articles like this and MANY others about Options and the Unusual Whales Platform on the new Information Hub!
Thank you as always for reading! Unusual Whales hosts an educational stream, LIVE, on YouTube, so be sure to check that out for live, on-screen education for options trading!
NOTE: This post is not financial advice. The stock market is risky, and any trade or investment is expected to have some, or total, loss. Please do research before any trade. Do not use this information for investment decisions. Check terms on site for full terms. Agree to terms before considering this information.