How to understand Gamma, Delta, GEX, DEX and more using Unusual Whales
As part of our free weekly educational series

🍒 Get a $50-$5000 bonus when you open an tastytrade x UW account 🍒
Hello!
This is the Unusual Whales Team, and we are going to spend every Wednesday or Thursday walking you through some trades of the week for free to help your trading!
In today’s issue, we’re going to cover some basic Gamma Exposure (GEX) concepts. We’ll break down what GEX is, and how to read some of the Unusual Whales Gamma Exposure tools! Keep an eye out on the Unusual Whales YouTube, where we will release a video explaining all of the GEX tools Unusual Whales has to offer! In this article, we’ll cover the Gamma by Strike chart, and the concept of Volatility Suppression by Market Makers.
Before we get started, you can get a $50-$5000 bonus when you sign up with tastytrade and fund your account!🍒
Simply put, Gamma is the rate of change of a given contract’s delta. To make a bit of a physics analogy here, Delta would represent your Velocity, and Gamma would represent acceleration.

Gamma hits its peak AT the money; as the spot price of the Underlying stock price moves around, At the money strikes will have the maximum gamma value on the options chain. BUT there are situations where the total Gamma accumulated on any given strike might be larger than the Gamma of the at-the-money strike. This just means there’s a ton of contracts there; a lot of trading going on.
This basic expression of gamma exposure on the first chart below shows you that the total gamma exposure for $AMZN has largely been positive over the last 6 months, even longer. If we roll back to September here for example to October 2023, we can see brief periods where total Gamma was negative rather than positive.
The easiest way to think about total GEX, positive Or negative, is to think about the option market counterparty, commonly called “market maker”, the way to think about MM reactions here is in a positive gamma environment, the MM is going to sell into rallies, and buy into dips, to offset their total exposure.
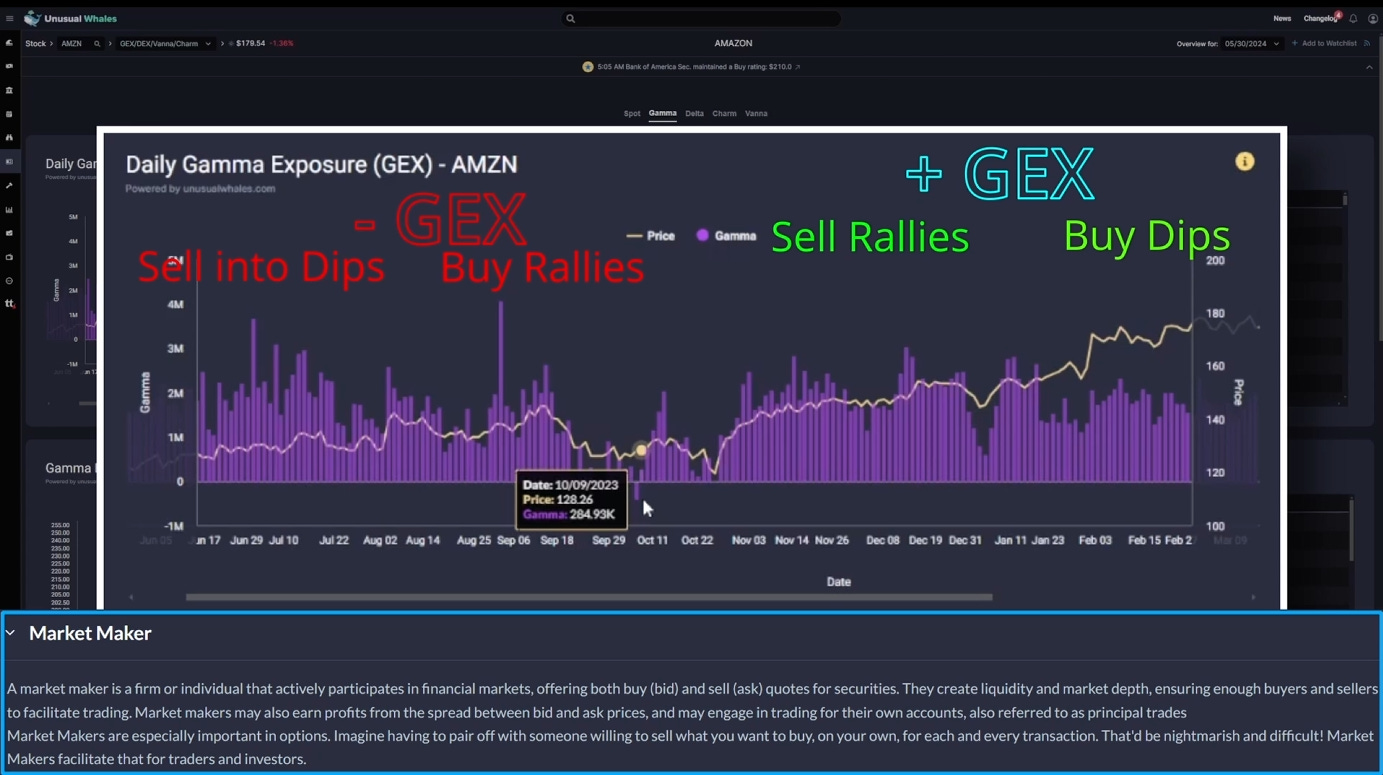
You can see some additional price volatility during times when the GEX environment is negative. But you can see for most of recent history, the GEX environment has been positive, so MMs have been gently selling into rips, and gently buying into dips.
GEX BY STRIKE
The next graph here is GEX by strike. One important thing to consider here, is this table ignores EXPIRATION dates of these contracts. So, if there is a lot of action on the $180 strike, that is valuable information to have, but you don’t immediately know the expiration dates of that call and put gamma.

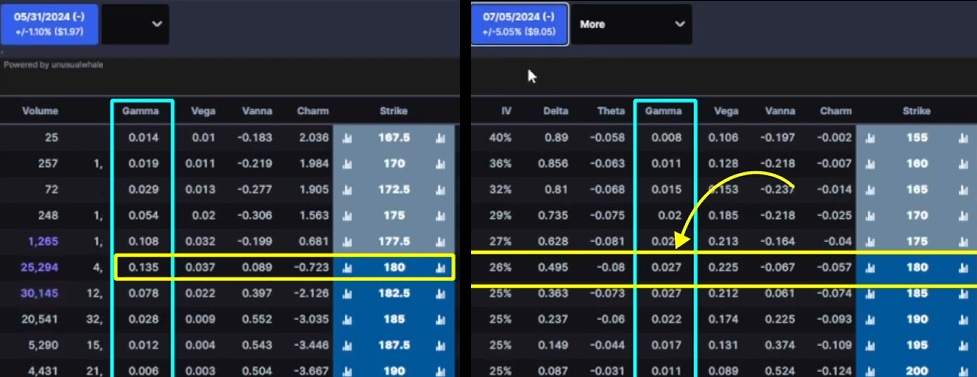
Now, that being said, Gamma is a short-term phenomenon. We can go look at options chains and transactions, and see that the NEARER dated options have higher Gamma than further dated options. So, for example, in the $AMZN chains, looking at the expiration for 5/31/2024, the Call Gamma for the $180 strike is 0.135. When we move to the 7/05/2024 expiration, that Gamma on the $180 call drops way down to 0.027.
So let’s phase out Net Gamma here next to just look at Call and Put gamma; Puts on left, Calls on right. This shows you by strike, where those gamma concentrations are. So here, on the call side, the biggest gamma concentration was $185 and for puts, it’s at $180.
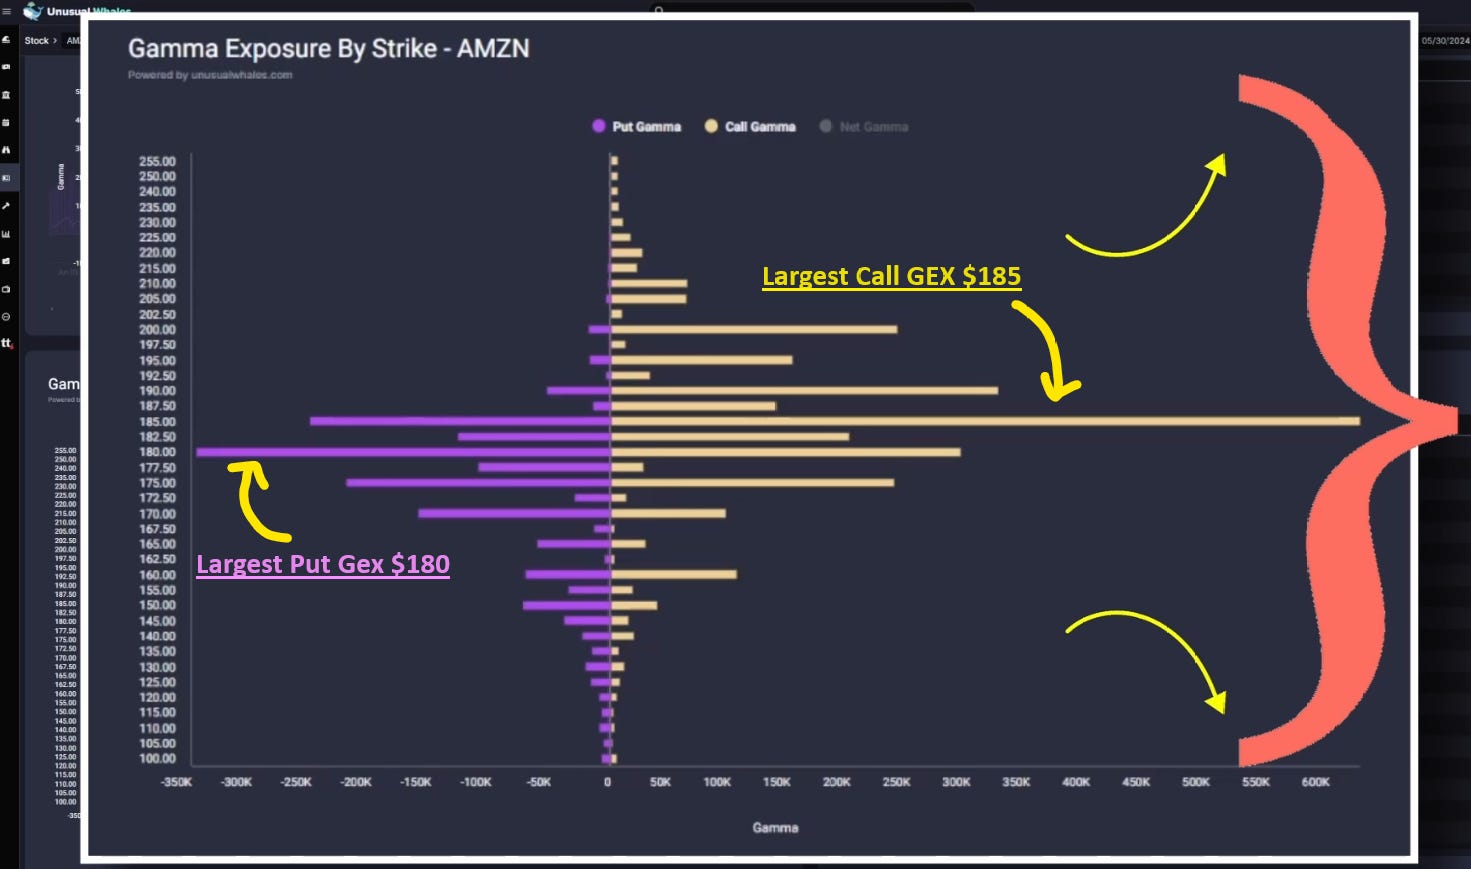
You can kinda see there’s a sort of curve here from top to bottom on the strikes; because remember, the ATM strike has the highest gamma value, regardless of expiration. So you’ll see as we move in price from strike-to-strike, either up or down, the further away from ATM we get, the Gamma exposure tends to drop.
🍒🍒Are you looking to start your trading journey?🍒🍒
Well, Unusual Whales has partnered with tastytrade to provide the best experience for you as a trader. Get the best platform for trading options and US equities, and get a huge exclusive signup bonus when you use our link.

We made it possible so that you can get a huge bonus if you open an account! Get up to $5000 when you open an account, and $50 upfront if you deposit even only $2000! You can also now TRADE ON UNUSUAL WHALES WITH TASTYTRADE! So come join today, and get a bonus to trade!
Now, back to GEX.
Let’s flip the table from call/put gamma individually to Net Gamma. This will show you the call gamma + the put gamma; this is a naive calculation meant to show you where we’ve built up open interest by strike, where the gamma is really concentrated. What’s interesting when you look at the net gamma view. This shows us that the $185 strike holds by far the most Gamma. It’s likely that market makers are long this contract.
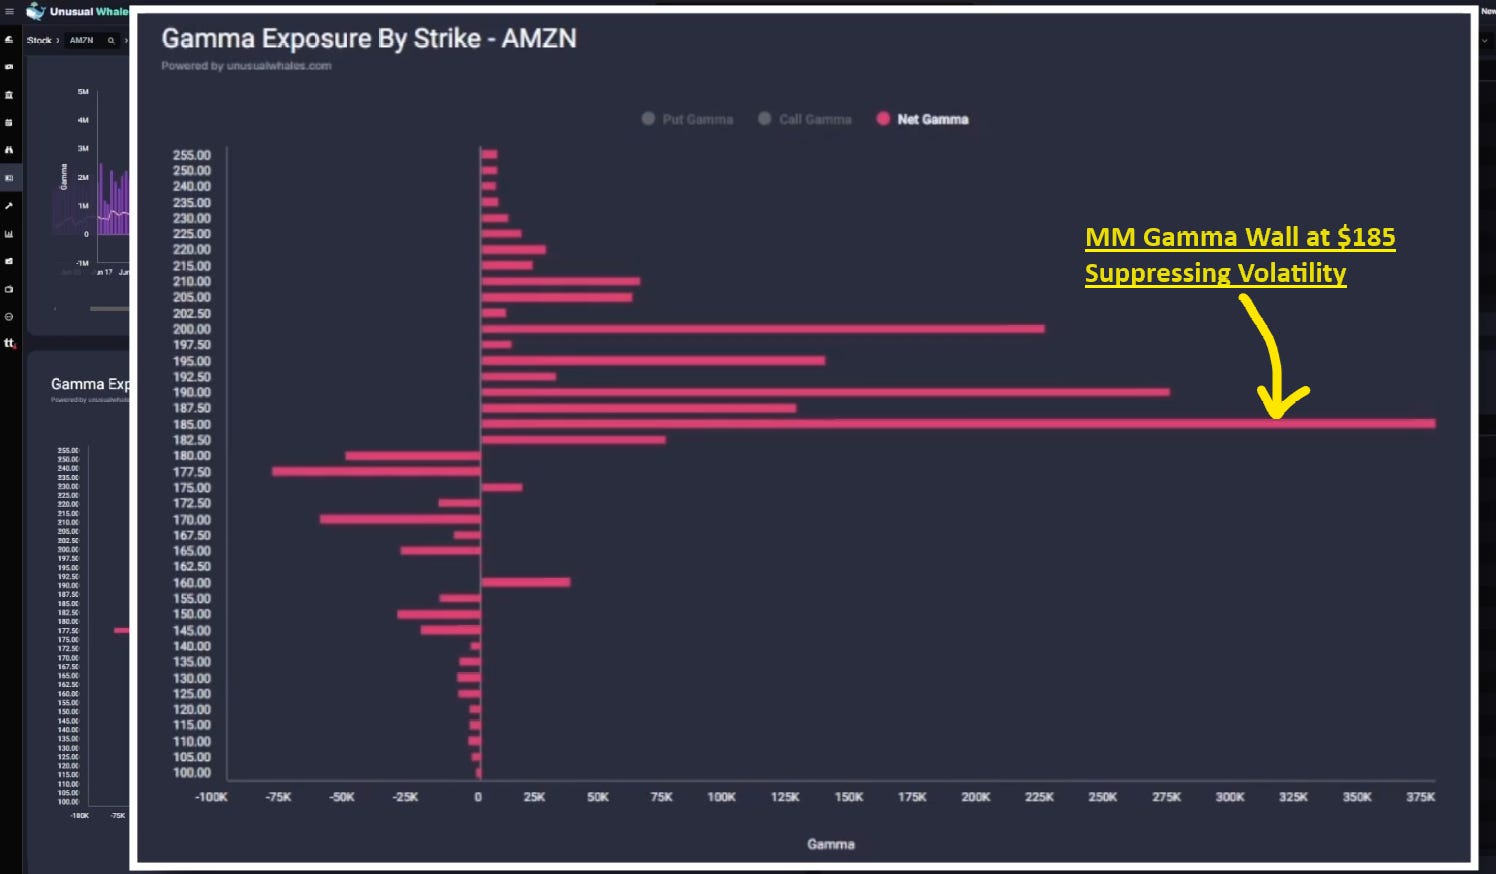
Market makers are suppressing volatility around that $185 level. As the stock price moves towards the strike, as gamma rises, market makers will be forced to sell more shares suppressing upside movement. As the stock moves back down, they will slowly buy back the shorted shares, overall suppressing any large stock volatility. We can actually see here on the daily chart how the daily candles are pretty uniform and small. There has been a steady uptrend without much price volatility day over day.

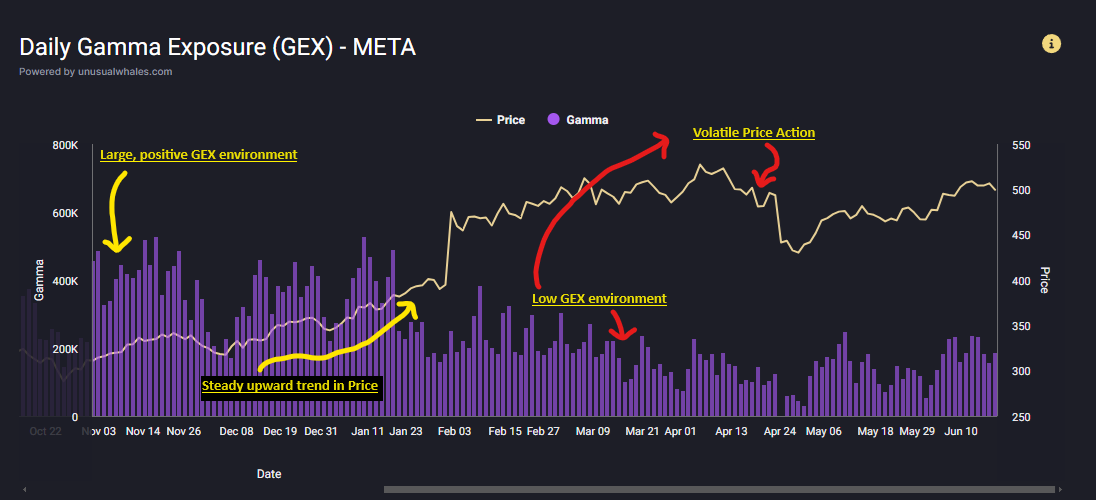
For another example, here’s a look at $META, which has had much less of a positive gamma environment than the $AMZN we viewed. When $META was in a consistently large positive GEX environment, the share price moved in that same steady uptrend we observe in $AMZN. But when the GEX environment is significantly less positive, and at times negative, the price action on $META becomes quite volatile, with much larger swings both up and down in the share price.
To give a closer look at this volatility suppression by Market Makers, let’s take the $AMZN chart down to a tighter time frame with the 5 minute chart from May 22nd, and look at what happened when $AMZN approached that $185 mark on the underlying stock price.

Remember, our assumption is that the vast amount of open interest on the $185 call strike rests with market makers. As $AMZN breached above $185 on the underlying, market makers lightly sold shares to suppress volatility above the strike. This led to a gentle intraday pullback in the $AMZN stock price. However, if you refer back to the daily chart above, we can see that $AMZN has enjoyed a steady uptrend with very little downside volatility. This is the result of our positive GEX environment, and volatility suppression by market makers.
Thank you as always for reading! Be on the lookout for more guides, walkthroughs, and Education on the Unusual Whales YouTube channel!
And remember; you can get a $50-$5000 bonus when you sign up with tastytrade and fund your account, and with a tastytrade account you can TRADE ON UNUSUALWHALES🍒
NOTE: This post is not financial advice. The stock market is risky, and any trade or investment is expected to have some, or total, loss. Please do research before any trade. Do not use this information for investment decisions. Check terms on site for full terms. Agree to terms before considering this information.