
How to enter directional moves after a stock is hit hard, a look at Google, and UW Spring Sale
How to enter directional moves after a stock is hit hard, a look at Google, and UW Spring Sale
As part of our free educational series.

Hey all,
This is the Unusual Whales Team, and we are going to spend every Wednesday/Thursday walking you through some trades of the week for free to help your trading!
In today’s issue, we’re going to cover a pair of Google, $GOOGL, trades that capitalized heavily on the upward trajectory in the stock after it took a beating; and although one trade closed prematurely, both trades saw handsome returns on the plays.
But first, Unusual Whales is having a Spring/Easter sale! Get 15% off any tier in Unusual Whales, and 20% off when you upgrade a tier!

Come learn some new trading tools this Spring before the sale ends! Go here for the sale: https://unusualwhales.com/settings/billing
Let’s start off the Google Analysis by taking a look at the first strike we’ll discuss, as they came in. On March 11, 2024, we saw a large influx of volume on the $143 call strike for April 12, 2024.
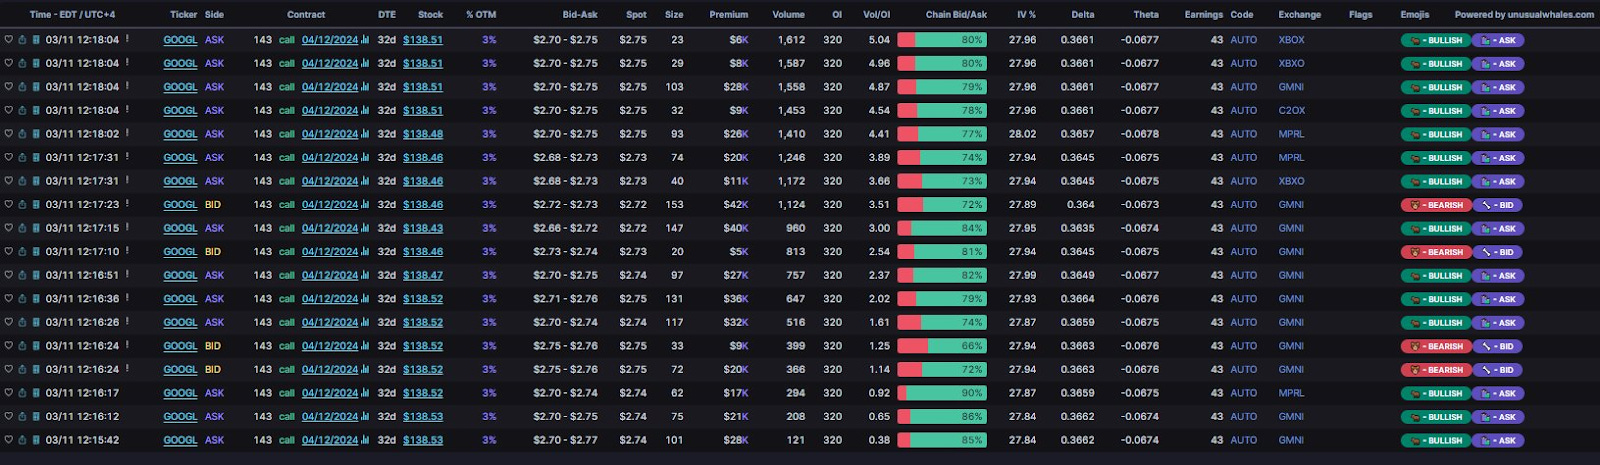
Over 1,600 volume transacted, mostly at the ask, for an average fill of ____ . The Open Interest at the time of these orders was only 320, meaning we can be fairly confident this is a new position, even though the size of each individual trade comprising this position was smaller than the total Open Interest.
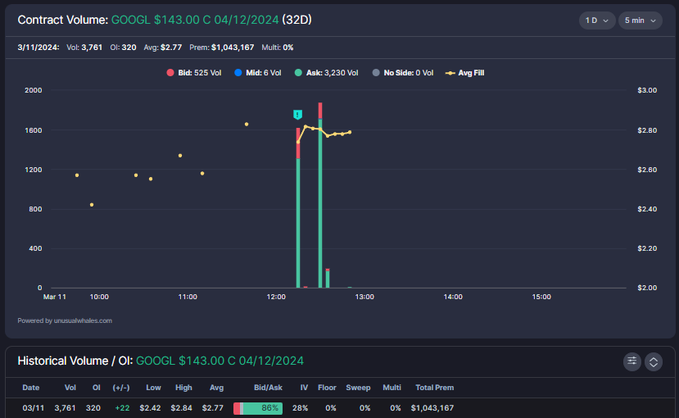
Half an hour later, another set of orders came in, totaling around 1,800 contracts, and another for around 200 contracts followed shortly after, bringing the total volume in these transactions to 3,600+ across the full position, with an average fill price per contract of $2.77.

This position held full until at least March 18th, where we noted evidence of a partial exit for an average fill of $8.76 per contract. Even though a lot of the contracts highlighted in yellow (the potential partial exit) hit as ask side, the drop in open interest the next day on 3/19 suggests the closure of some positions. The original entry of $2.77 hit a percentage gain of 216% before we saw evidence of any contracts closing.
Let’s look at another!
On March 7, before we caught those $143 calls, the $135 contracts for May 17, 2024, and the $155 call for July 19, 2024. First, the $135C 5/17/2024.

Above, we have the full historical profile for the contract from the point of entry to the exit. We first noted significant flow on 3/7/2024 when 22.8k contracts transacted mostly at the ask, ranging from $6.51 to $7.89. Of this volume, over 17k contracts carried over into open interest, confirming all new positions. They held these contracts until 3/14, where they took profit for an average fill of $11.58 per contract; a roughly 82% gain from the original entry of $6.51. As you can see, at the tail end of the chart, this trader cut the trade a bit prematurely, as a few days later the contract reached a new high of $19.00. But when you see an 82% gain, there is never any shame in taking profits!

Now, the $155C for July 19, 2024. Above we see the entry on March 7th, the same day we saw those $135C open. Roughly 7,000 contracts transacted mostly at the ask for an average fill of $2.77 per contract. Within a day, these contracts had already reached a profit of $1.40 per contract; but our trader held. On 3/14, the day the $135C exited their trade, the $155c hit a high of $5.75 per contract. However, unlike our $135C trading friend, the $155C held onto their full position.
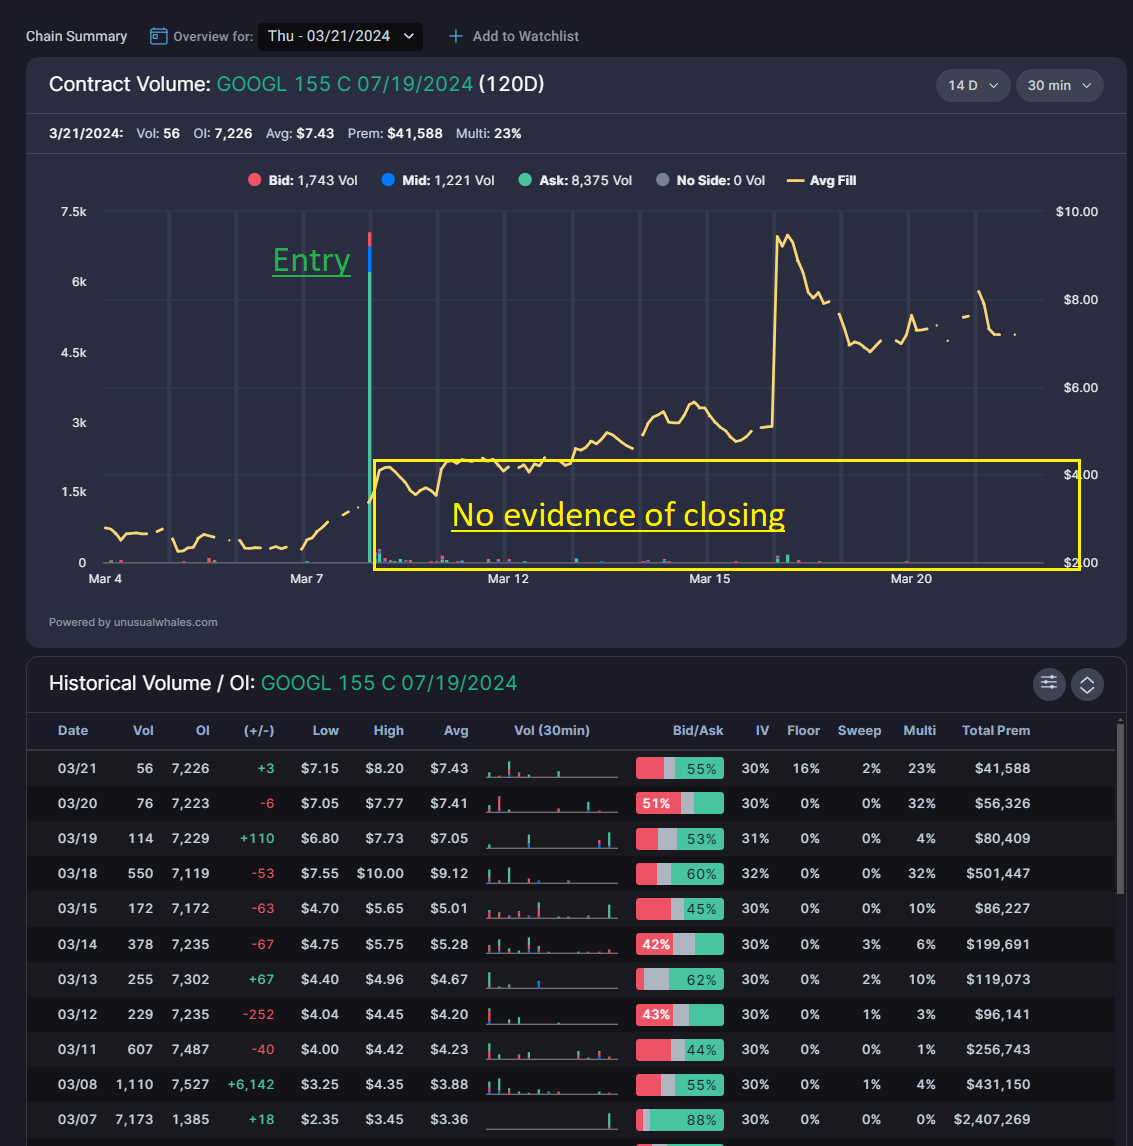
We can see here that our $155C trade is still open. Note the volume candle marked ENTRY where the position opened. In the weeks that followed, there were no days where enough volume transacted to suggest to us that the position closed. At its peak price, this $155C 7/19/2024 hit a gain of +$7.23 per contract; or +261%. However, as we noted, they did not close their position. As of 3/21, this position is still open, sitting at a profit of +196%.
Thank you as always for reading! I hope this article and the examples using $GOOGL paint a good picture of how to spot and track flow over time!
Once again, if you want to learn how to trade flow, use options more, or fade moves or volatility using options, we are currently having one of our best sales of the year! Check it out by clicking here!
NOTE: This post is not financial advice. The stock market is risky, and any trade or investment is expected to have some, or total, loss. Please do research before any trade. Do not use this information for investment decisions. Check terms on site for full terms. Agree to terms before considering this information.