Basic flow and understanding the Options Contract Chart
As part of our free weekly educational series


Hey all,
This is the Unusual Whales Team, and we are going to spend every Thursday walking you through some trades of the week for free to help your trading!
These educational tutorials will be options or equities focused to help you understand why or how interesting and useful trades were made. If you enjoyed this, feel free to subscribe to support or share the Substack and get our podcast 24 hours earlier than Spotify!
In today’s edition, we’re going to go over some basic flow reading principles. Specifically, we’ll cover how to cross-reference the Options Contract Chart with the Flow Feed to confirm which side of the trade any given transaction may lie. This should help you understand that the options contract chart alone can be misleading, and that you must also check the flow feed, and what to look for in the feed, to confirm the side of the trade.
To kick us off here, the options contract chart can be a very helpful tool. It gives a quick view of volume and where the orders lie in reference to the bid and ask. The options contract chart will show you:
1.) Ratio of Volume to Open Interest
2.) Bid/Ask Skew (on which side (bid/ask) most (or all) of the volume transacted)
3.) What the volume looks like on a given time frame
4.) The percentage of volume transacted as multi-leg orders
5.) Notional value; how much Premium has transacted on the contract
6.) How many total trades/transactions occurred
7.) Historical charting (what did volume look like in the past?)
8.) A link to take you to the raw data from the flow
This step is absolutely crucial, and is the main focus of this newsletter
The main reason I want to focus on this today is because yes, the contract chart is extremely helpful, at a glance. Even with all the information contained within the chart, the chart alone can be misleading as there are some very important pieces of information the chart does not contain. These include:
The order in which the activity comprising that volume occurred (fill order/time stamps)
How the contracts behaved during transactions (Did the bid/ask/fill prices and/or Implied Volatility change during the orders?)
Was the order a singular block? Were there multiple participants?
You may say, “But the contract chart clearly shows the orders are ASK SIDE! What more could I need?” Well, let’s take a look at some examples; as I said, the option chart alone can be misleading without this additional context from the raw data.
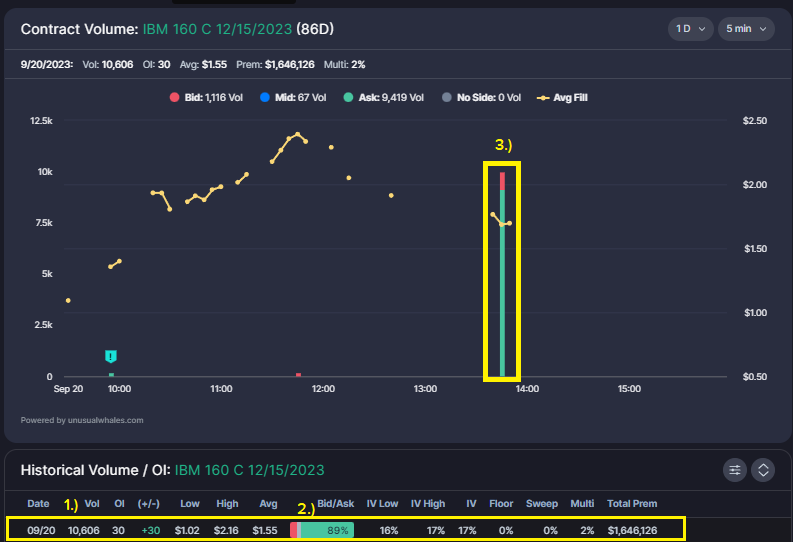
We’ll start with this example on $IBM from 9/20/2023. Looking at the option chart for $IBM $160c 12/15/2023, we see over 10,000 volume (1) transacting almost entirely (89% of volume) at the ask (2), within a 5 minute window (3). “Damn,” you may think, “10,000 volume ASK SIDE?! Must be pretty bullish, I’m in!”
Not so fast. We need to verify the orders using raw data from the flow feed. After clicking the link embedded into that volume bar in the chart, we’re taken to the raw flow feed for the contract.
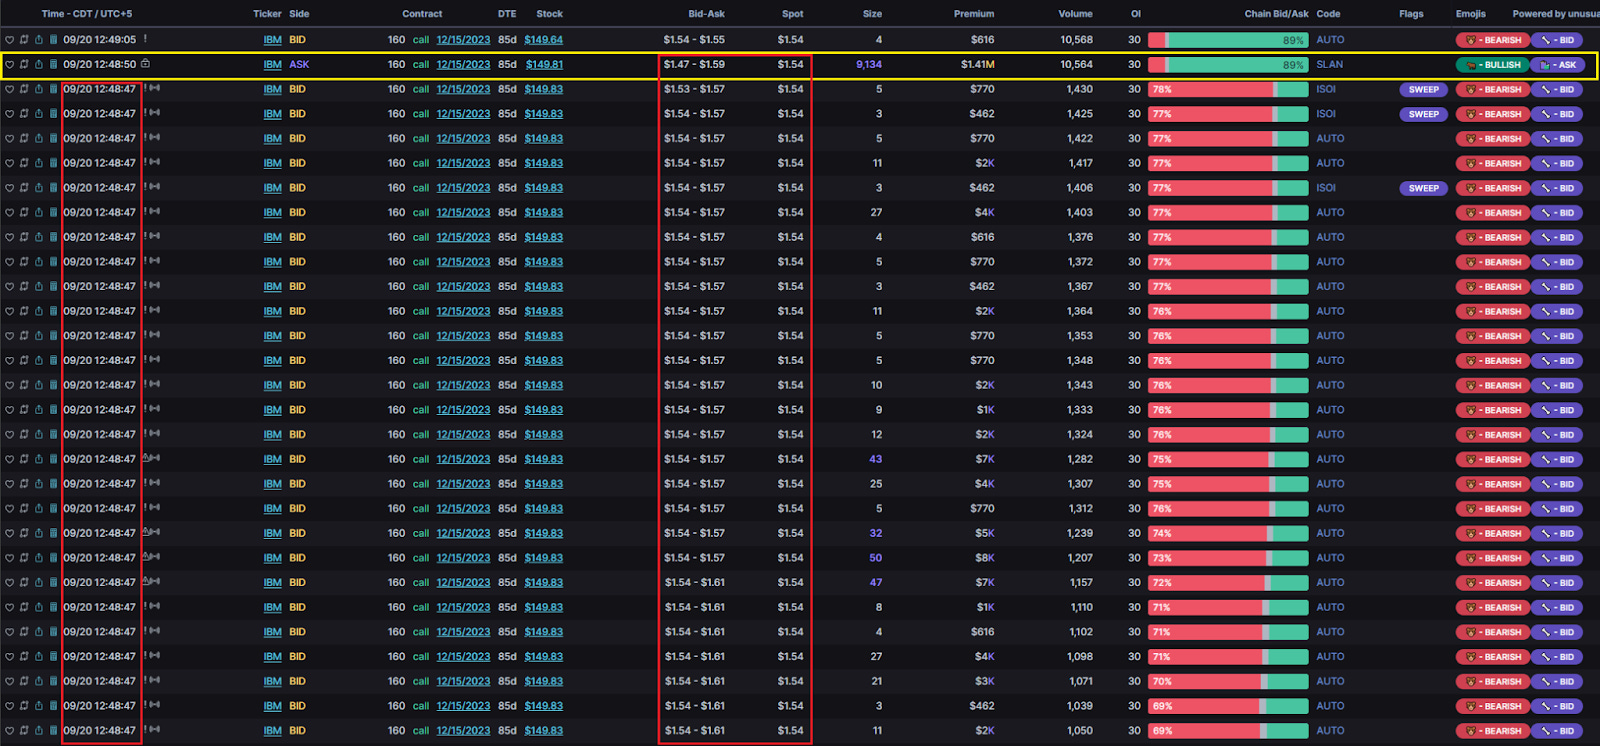
In the image above, boxed in yellow, we have the bulk of that 10,000 volume transacted on the contract. It’s flagged “ASK”, but that doesn’t necessarily mean it was convincingly ask side. Looking at the BID-ASK at the time of the transaction, we see a bid of $1.47, and an ask of $1.59, with the fill price (the “spot”) at $1.54. So yes, the transaction occurred closer to the ask than the bid, but it’s not convincingly at the ask given the fact $1.54 falls relatively close to the MID of that bid/ask spread. Now, this alone doesn’t necessarily discredit the option contract chart’s display of mostly ask-side fills. However, further context directly below this order very well may.
Before we dive into the surrounding flow context, please take a moment to check out today’s sponsor,TradeStation is an equities, options, futures, and crypto broker. TradeStation has independent, self-clearing in all major asset classes (one of the few still available, as most brokers typically clear their orders through another firm).
And now, you can trade directly from your Unusual Whales dashboard by linking your TradeStation account! Unusual Whales subscribers get up to $5000 with qualifying deposit when you open a TradeStation Account and trade on Unusual Whales with the new trade tab. So create your account today, and start trading directly from the Flow!
Surrounding Flow Context
Here, we’ll shift our focus to the time stamp to the left and the bid/ask/fill of the orders that occurred immediately prior to our big order of 9,134 contracts. Our big order transacted at 12:48:50pm Central time for $1.54 per contract. A mere three seconds prior to this order, a couple hundred contracts transacted in separate orders, all at the same time stamp of 12:48:47pm. These orders also filled at $1.54 per contract, but are marked as BID. So, what changed?
In that short three seconds, the BID/ASK spread flipped. When the orders prior to the 9,134 volume hit the tape, the bid/ask spread was $1.54/$1.57, meaning these orders filled exactly at the bid. By the time our larger order hit, the bid/ask had shifted, with the best available bid for the contract sitting at $1.47. This shifted the fill price of $1.54 closer to the middle of the spread. However, given the identical fill price, and the timing in which the total volume for that time frame hit the tape, we can speculate that our large order may be included in those smaller preceding orders. This indicates that our 9,134 volume order is more likely a WRITE, or a sell, than it is a BUY.
It’s important to note that, if you’re a fan of the Open Interest Explorer, everything we’ve discussed in this newsletter directly applies to checking for large open interest changes on any given day, as well.
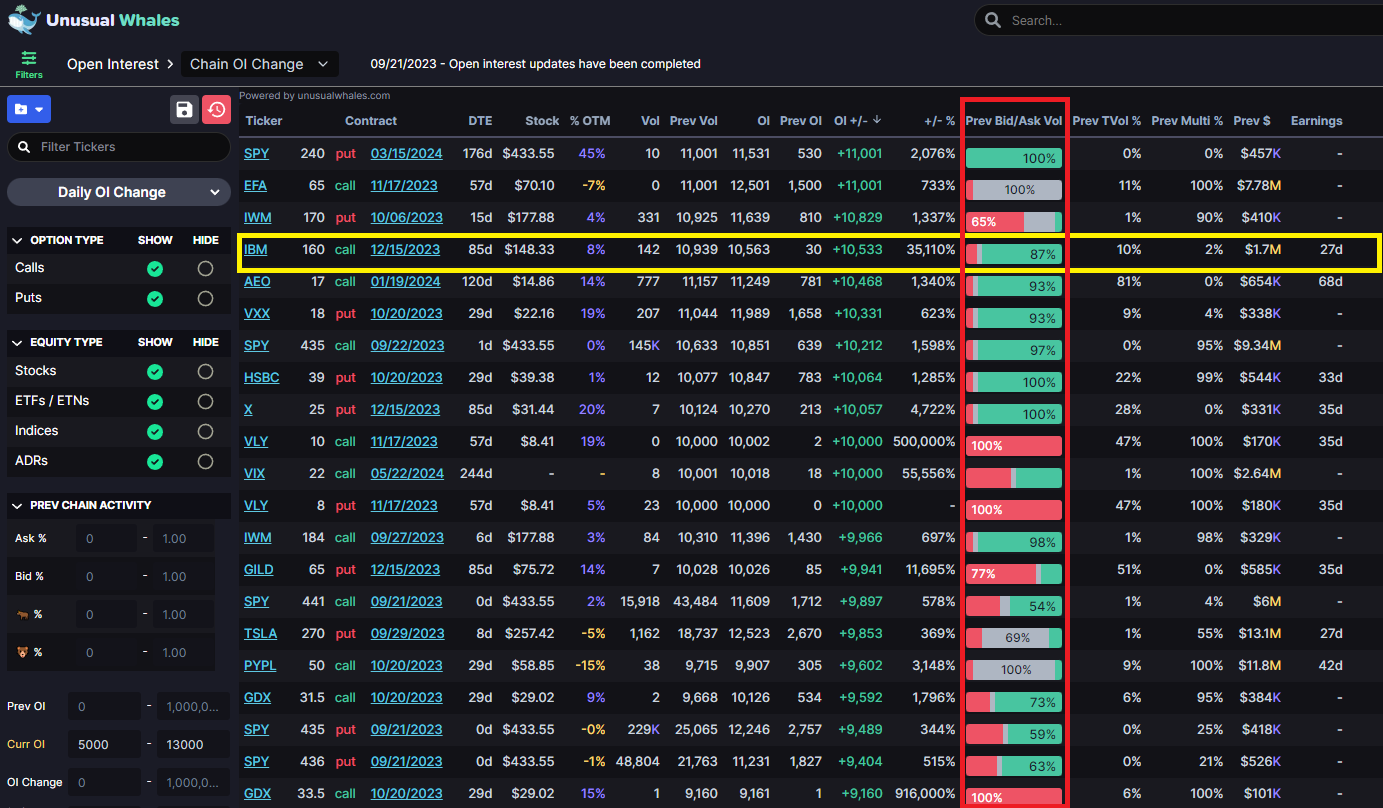
Here we have the Open Interest Explorer filtered to account for “Current OI 5,000 to 13,000” and “OI % Change” 2,000% to 10,000%. When checking the Open Interest Explorer, generally a decent cursory glance of the “Prev Bid/Ask Vol” column (in red) can give us an idea of which contracts to take a closer look at. In yellow is the IBM contract we just discussed, with a Prev Bid/Ask Vol showing 87% of the prior day’s volume transacting on the Ask Side.
That gives us a little eyebrow raise, and directs us to look at that contract a little closer. Following the steps we outlined throughout this newsletter, we’ve determined that the $IBM $160C 12/15/2023 was likely not as bullish as the option chart seemed to indicate. Instead, we ascertained the flow was more likely bearish. So, remember: context matters, always check the raw data!
I hope this issue gives you a good idea of how important context is. Yes, the Option Contract Chart is extremely effective; but it doesn’t give us the full picture and can be misleading. The option chart and the open interest explorer alike should be used mainly as a first, at-a-glance reference point; as a springboard for what specific options flow is worth a deeper look.
For more on this topic, check out the full-length instructional video on YouTube
here:
Have a great weekend!
Today’s sponsor was TradeStation, get up to $5,000 when you open an account with a qualifying deposit today!
NOTE: This post is not financial advice. The stock market is risky, and any trade or investment is expected to have some, or total, loss. Please do research before any trade. Do not use this information for investment decisions. Check terms on site for full terms. Agree to terms before considering this information.
NOTE: Unusual Whales is not responsible for any promotion. It does not verify the authenticity of the promotion or partnership, nor the merits of the individual promotion. Unusual Whales does not necessarily endorse any one promotion. Please do your own diligence and research before following any one promoted post. Do not consider a promotion of a post an advocation for the sponsor of the post. Do not invest because of any promotion. Do not follow any promotion unless you yourself think it worthwhile. Unusual Whales is not affiliated with any sponsor. Unusual Whales is being paid to promote the promotion. The post itself is an ad, and not a reflection of Unusual Whales itself. Please check full terms for details.