
How to trade Gamma and GEX with UW options and tools
How to trade Gamma and GEX with UW options and tools
As part of our free weekly educational series.

Hey all,
This is the Unusual Whales Team, and we are going to spend every Wednesday/Thursday walking you through some trades of the week for free to help your trading!
In today’s issue, we’re going to cover the Unusual Whales Gamma Exposure (GEX) tool using an example straight from the platform. Greeks can be really complicated, so hopefully the Unusual Whales tools can make them a little easier to understand!
But some UW news first! Unusual Whales is having a Spring/Easter sale! Get 15% off any tier in Unusual Whales, and 20% off when you upgrade a tier!

Come learn some new trading tools this Spring!
So we’ll get right into Gamma and Gamma Exposure! Keep in mind that all options data is time sensitive and the values used in this article may not remain accurate. The concepts themselves, however, are timeless :)
What is Gamma?
Gamma is the instantaneous rate of change of delta (link to delta?).
Gamma is the only second order Greek that has a direct response with price movement of the underlying. Oftentimes, you will see gamma lumped together with the other first order Greeks, and this is done so because of gamma’s importance.
Gamma is the same for both call options and put options, with long calls/puts having positive gamma, and short calls/puts having negative gamma.
What is Gamma Exposure (GEX)?
SPOT GAMMA EXPOSURE (GEX) is the assumed $ value of gamma exposure that market makers need to hedge per 1% change of the underlying stock's price movement. A positive value is long gamma while a negative value is short gamma.
Investors and large funds lower risk and protect their money by selling calls and buying puts. Market makers provide the liquidity to facilitate these trades.
GEX assumes that market makers are part of every transaction and that the bulk of their transactions are buying calls and selling puts to investors hedging their portfolios.
If a market maker has one contract open with a gamma value of 0.05, then if the underlying stock price moves by 1%, that market maker is exposed to $[0.05 gamma * (100 shares * 0.01) * stock price * underlying parameter of the greek variable]. The total market maker spot exposure is calculated by summing up the spot exposure of all open contracts determined by the daily open interest (purple) or by volume (yellow).
The Unusual Whales Spot Gamma Exposure GEX Tool allows you to visualize this in real time for any given ticker.
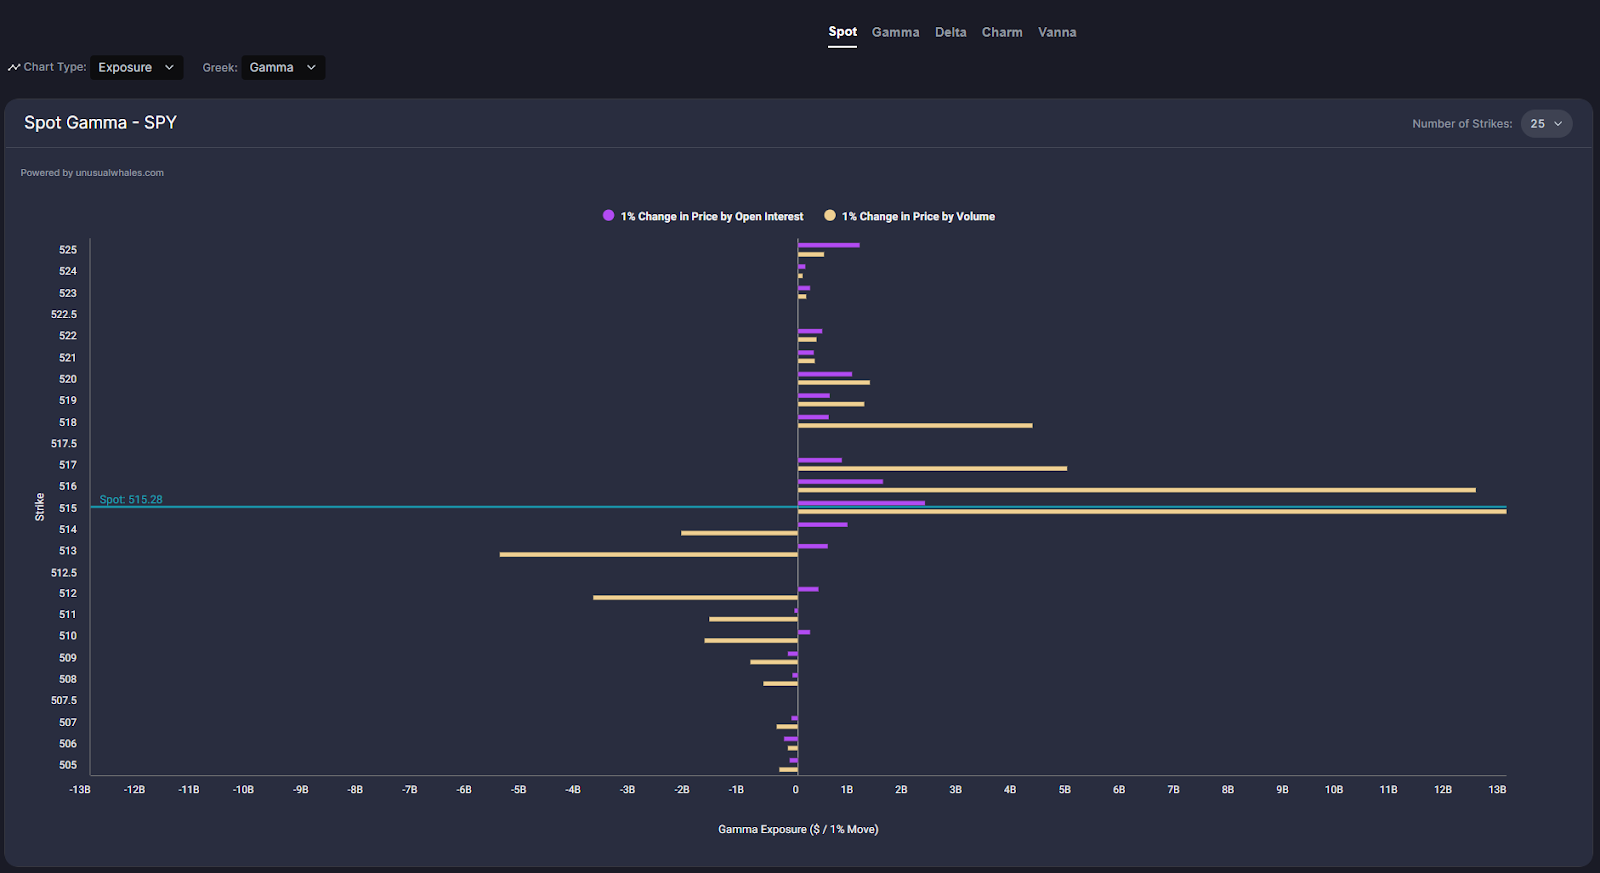
What is the Gamma View?
The Unusual Whales Gamma View is a visualization of gamma, calculated from open interest each morning based on the spot price of the underlying at yesterday’s close, in four unique ways:
Daily Gamma Exposure (GEX)
Gamma Exposure by Strike
Gamma Exposure by Expiry
Largest GEX by Strike And Expiry
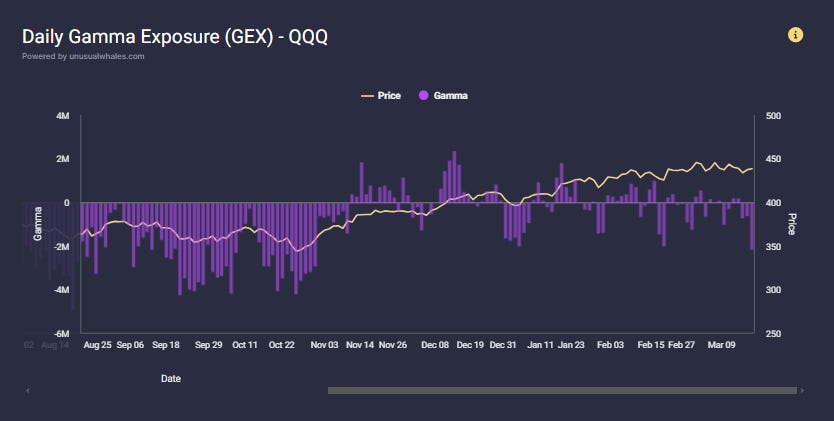
Daily Gamma Exposure (GEX) pictured above is the sum (meaning all strikes across all expiries) of call gamma and put gamma. On average, realized volatility tends to be lower (price moves less) when this sum is positive and higher (price moves more) when this sum is negative.

Gamma Exposure by Strike pictured above displays exactly that; which strikes across the sum of expiration dates have the most Gamma Exposure. In the image above, the $MSFT $410 strike has the most Put Gamma (negative), whereas the $425 strike has the most Call Gamma (positive). However, it may not always be the case that the most Net positive or Net negative Gamma falls on the same strike as the most Call or Put gamma; it’s contingent on the sum of Call Gamma (positive gamma) and Put gamma (Negative gamma).
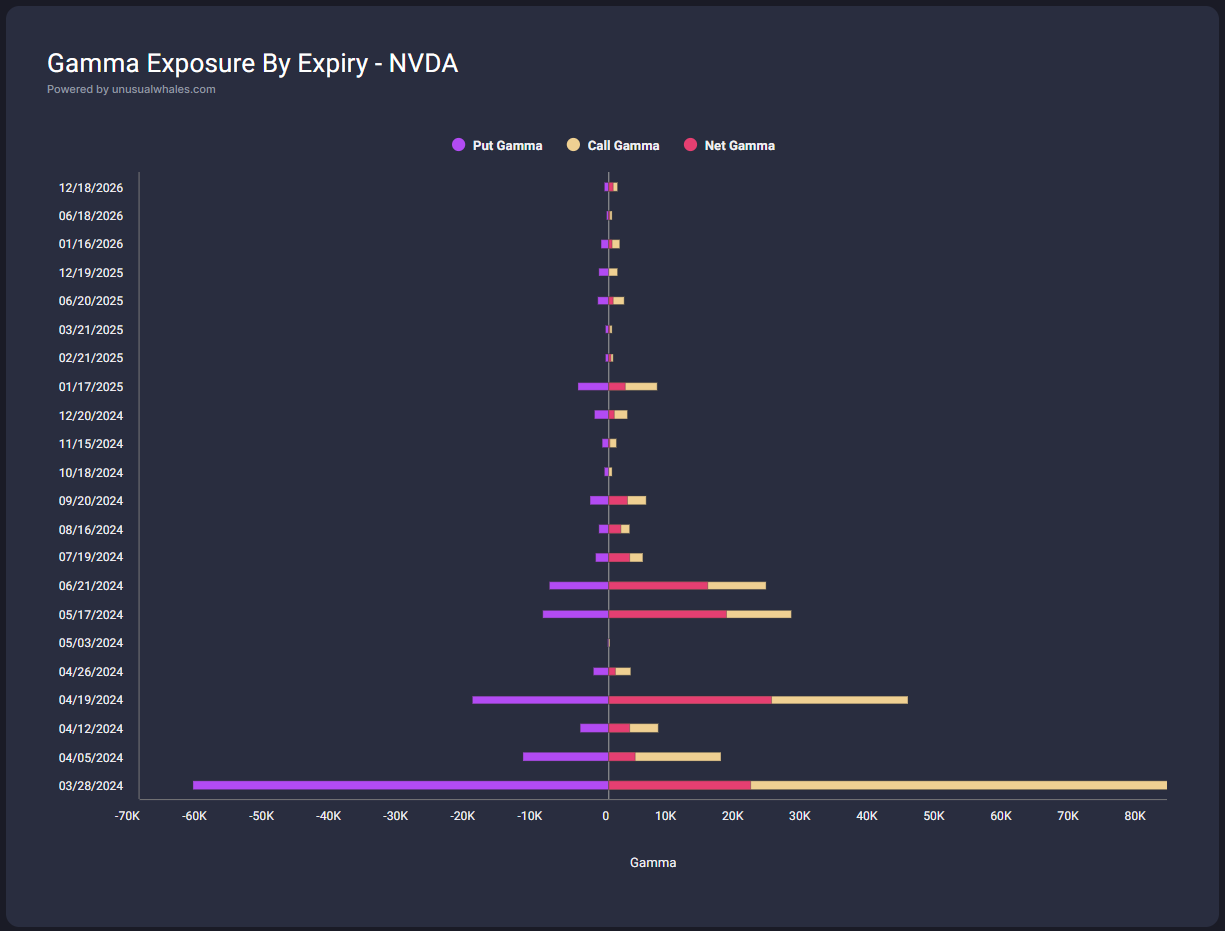
Gamma Exposure by Expiry pictured above displays which expiration date across all strikes hold the most Gamma Exposure. In the above image, we can see that the expiration date with the most Gamma Exposure for both Puts and Calls across all strikes for $NVDA is the March 28, 2024 expiration.
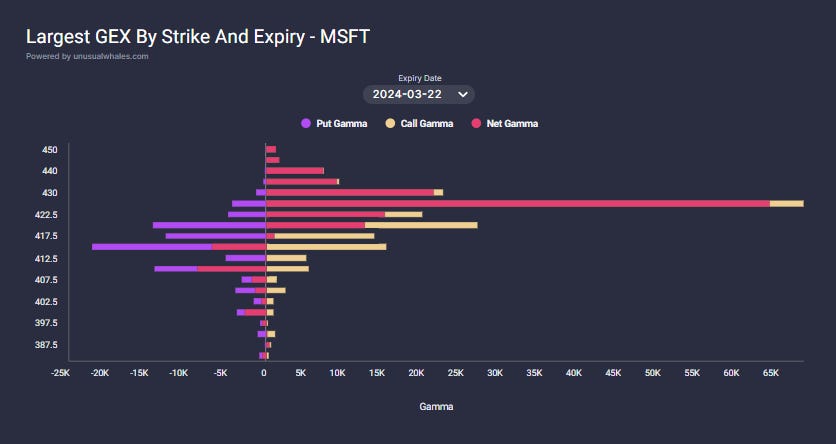
Largest GEX By Strike And Expiry pictured above displays, by expiry date (which you can adjust from the dropdown above the chart), the GEX by strike. This chart is updated once per day, in the morning, after OI updates occur.
Recall that gamma is larger in closer-dated expiries than further-dated ones, and note that within the same expiry gamma is largest at the ATM strike and gets smaller in both directions as strikes get further away.
How can you use Largest GEX By Strike And Expiry to make better-informed trading decisions? Consider the Largest GEX By Strike And Expiry chart above from pre-market on Tuesday Mar 19th, 2024. The careful observer can see that the largest Put (negative) GEX bar for this week’s expiration (again, recall that gamma is largest near-term) at the $415 strike, which was slightly OTM based on the MSFT close price of $417.32 on Monday Mar 18th, 2024. Using this same technique, we see that the largest Call (positive) GEX bar for this expiration is at $425.
If the price of MSFT were to trade up into the $425 area or down into the $415 area, we might see a mean reversion-type price reversal. Think about it: we know these are short-dated options, expiring in only a few days, meaning traders have limited time to act on these positions. Consider the speculator buying $415Ps expiring the same week. If MSFT price in this example were to drop from $417.32 and decline closer to $415, the price of those $415Ps would appreciate significantly.
The speculator might monetize those long $415Ps and collect the profit, which en masse can create buying in $MSFT stock. If price does not keep declining and instead begins to reverse back up, anxious $415P buyers might be inclined to sell to and cash-in modest profits if they fear that this is “the bottom”.
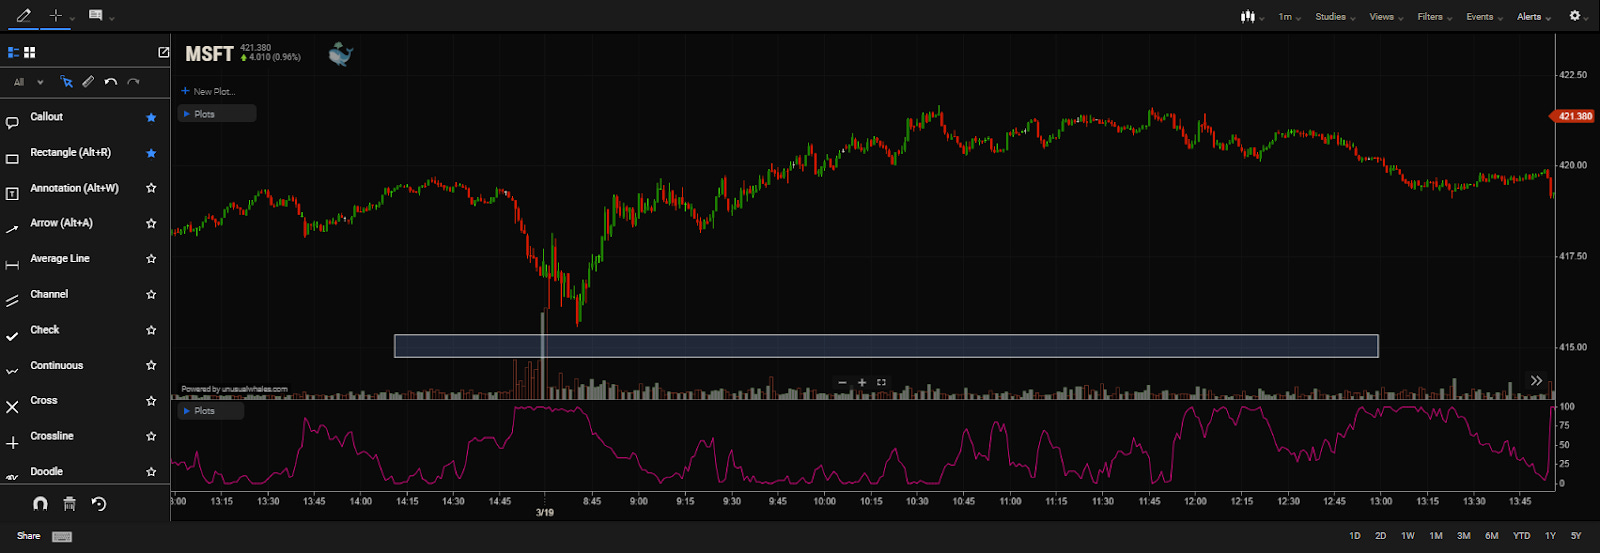
Looking at the one-minute candlestick chart image above for $MSFT on Tuesday Mar 19th, 2024, we can see that price did indeed trade down into the $415 range (low of $415.55) before reversing back up. Our diligent trader drew a rectangle around the $415 area of that chart as a visual reminder of this positioning.
It’s important to note that even if no one monetizes their $415Ps, large negative gamma will result in higher volatility and big bounces because shares are sold on the way down and bought on the way up. We have a ton of other Greek tools, which we will break down soon. You can always check out our glossary and faq for more info!
Thank you as always for reading! I hope this article and the examples make it a bit easier to understand how to read and utilize the GEX tool! In a later issue, we’ll cover both Vanna and Charm Exposure, so be on the lookout!
NOTE: This post is not financial advice. The stock market is risky, and any trade or investment is expected to have some, or total, loss. Please do research before any trade. Do not use this information for investment decisions. Check terms on site for full terms. Agree to terms before considering this information.